> ## Documentation Index
> Fetch the complete documentation index at: https://docs.blacksmith.sh/llms.txt
> Use this file to discover all available pages before exploring further.
# CI Analytics
> Fastest way to monitor your GitHub Actions performance and costs across your team
## Overview
Blacksmith's CI Analytics dashboard provides a single view of your
CI pipeline's **performance**, **failure rate**, and **costs**.
All users within your organization who have access to GitHub can log
in at [app.blacksmith.sh](https://app.blacksmith.sh) to explore the dashboard.
## Basics
### Jobs
The dashboard displays every job run across all your repositories.
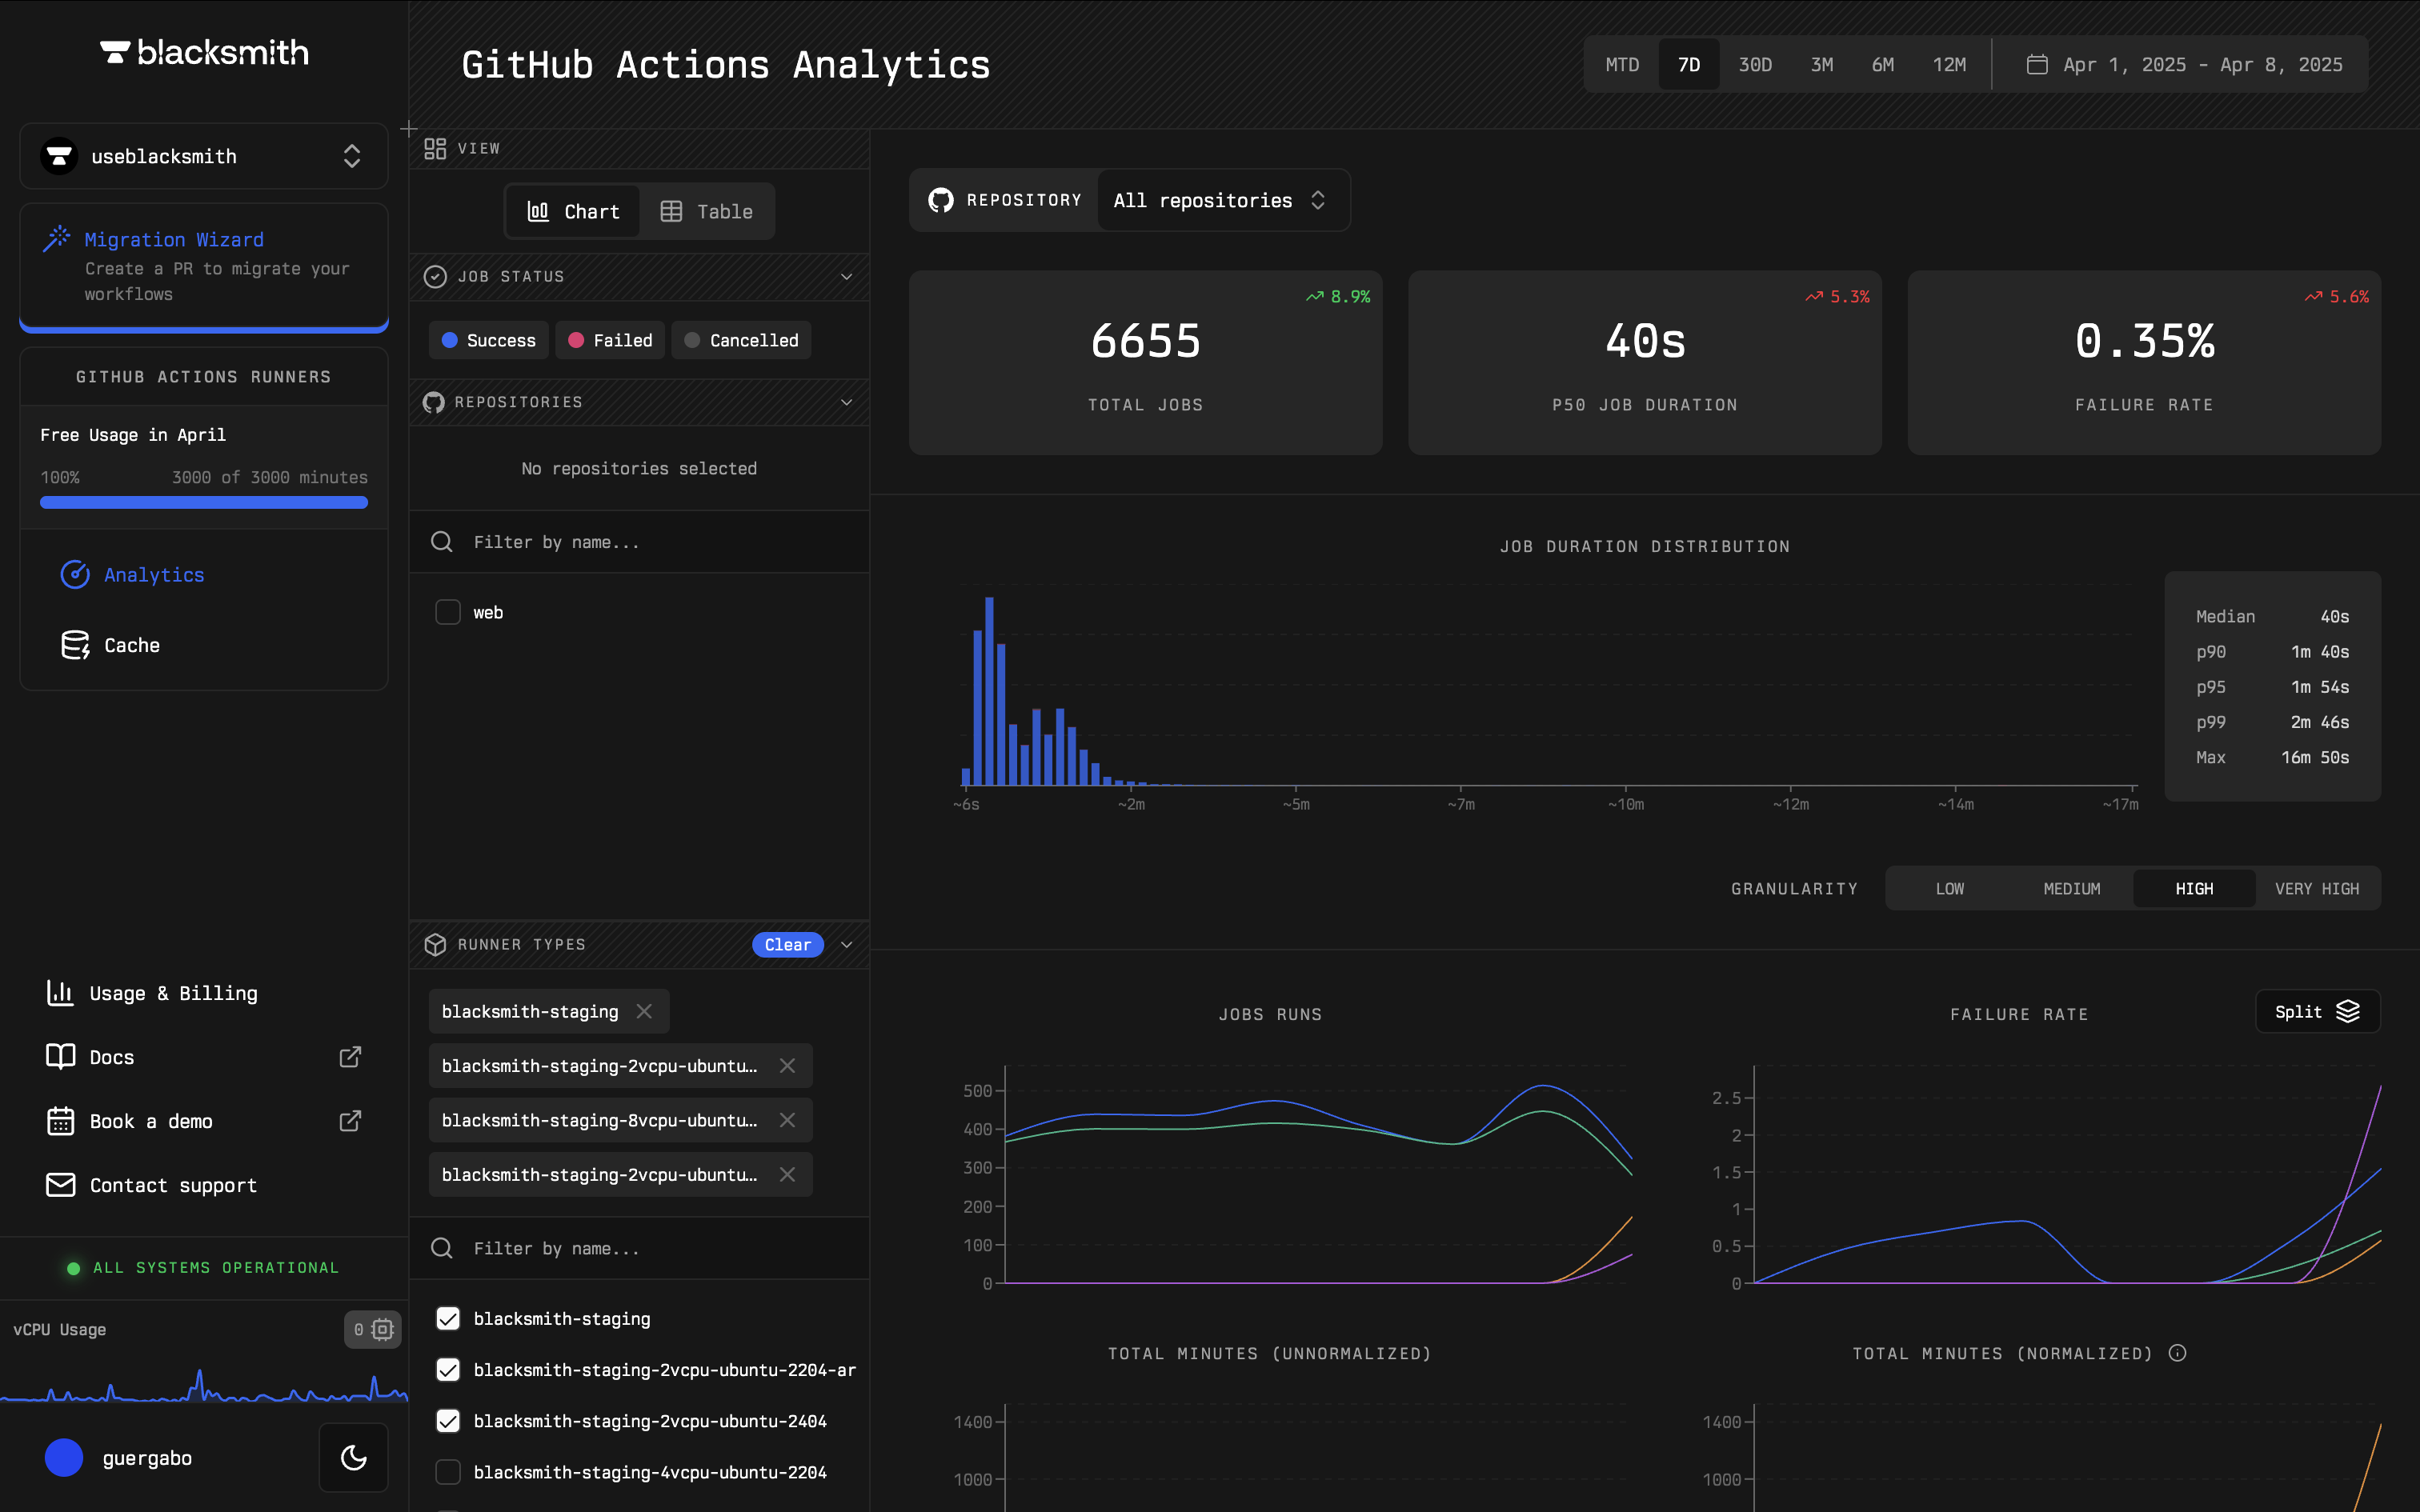 You can filter and analyze jobs by repository, runner size, job status, and more, enabling you to answer questions like:
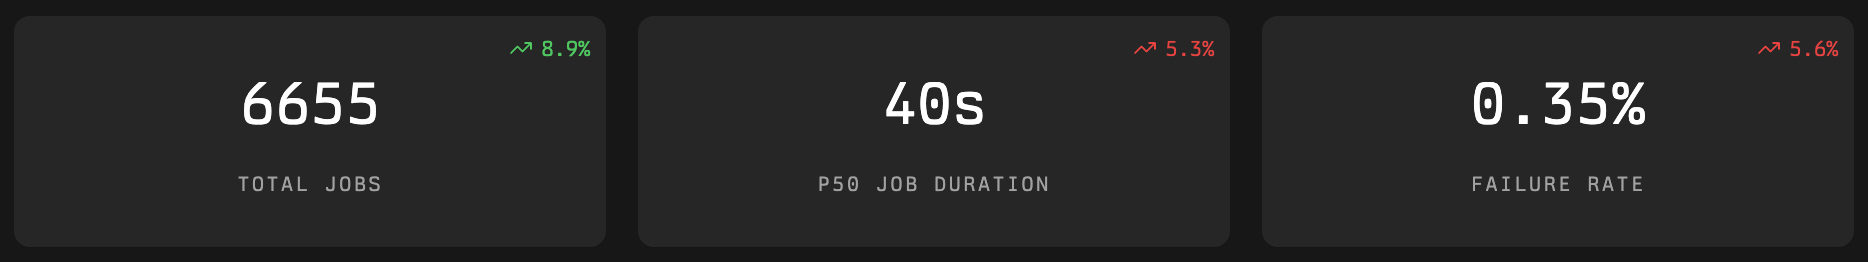
* "What is the failure rate of my jobs?"
* "How long does this job typically take to complete?"
* "What is affecting the performance of my slowest job?"
For instance, Blacksmith's dashboard helps identify if a job is failing more often than usual. By filtering jobs by repository, you can assess failure rates and compare them to previous months.
You can filter and analyze jobs by repository, runner size, job status, and more, enabling you to answer questions like:
* "What is the failure rate of my jobs?"
* "How long does this job typically take to complete?"
* "What is affecting the performance of my slowest job?"
For instance, Blacksmith's dashboard helps identify if a job is failing more often than usual. By filtering jobs by repository, you can assess failure rates and compare them to previous months.
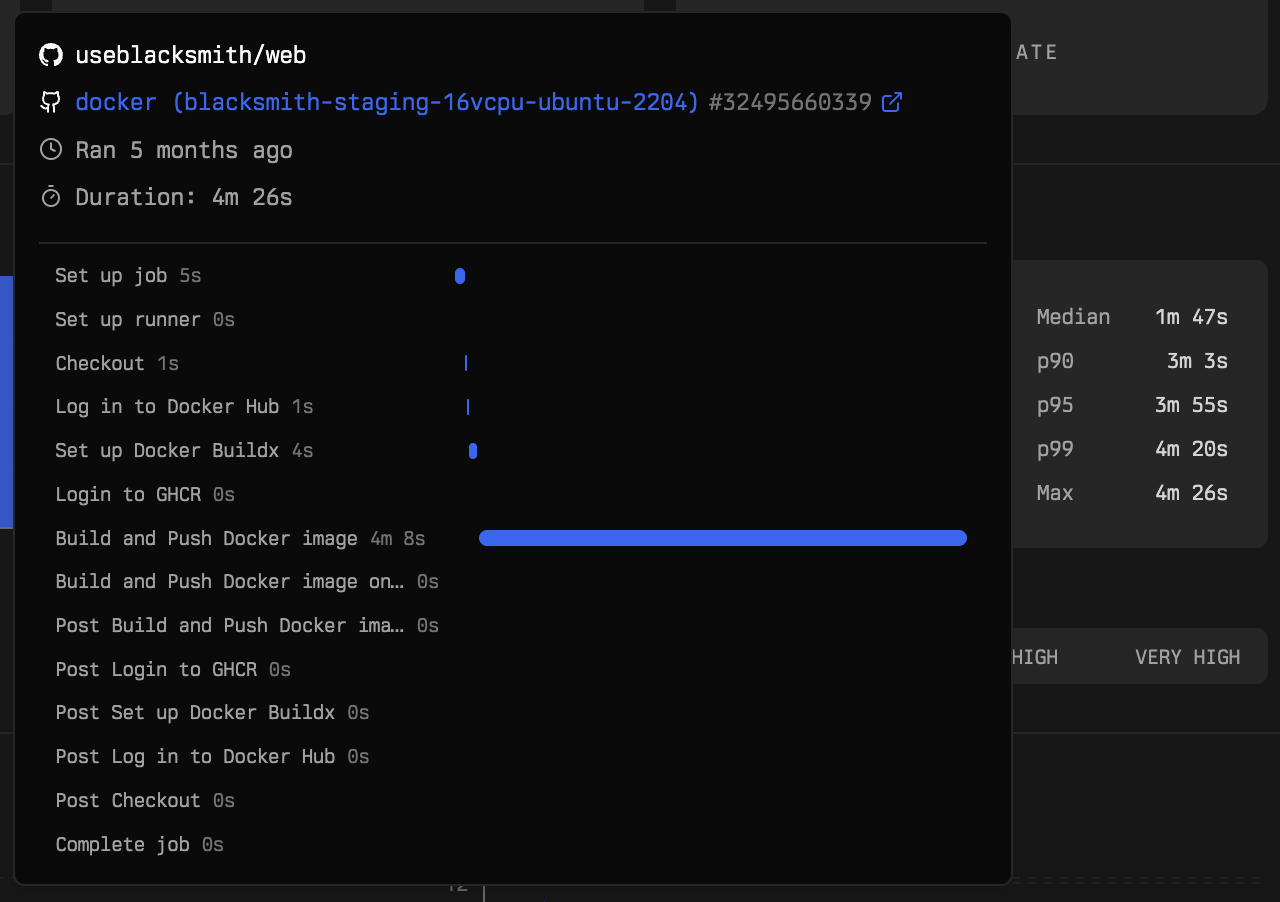
 Blacksmith's dashboard helps identify what is affecting the performance of your slowest job. By hovering over the "p99" in the job duration distribution chart, you can see a breakdown of your slowest job's steps and the time taken for each step.
 ### Caches
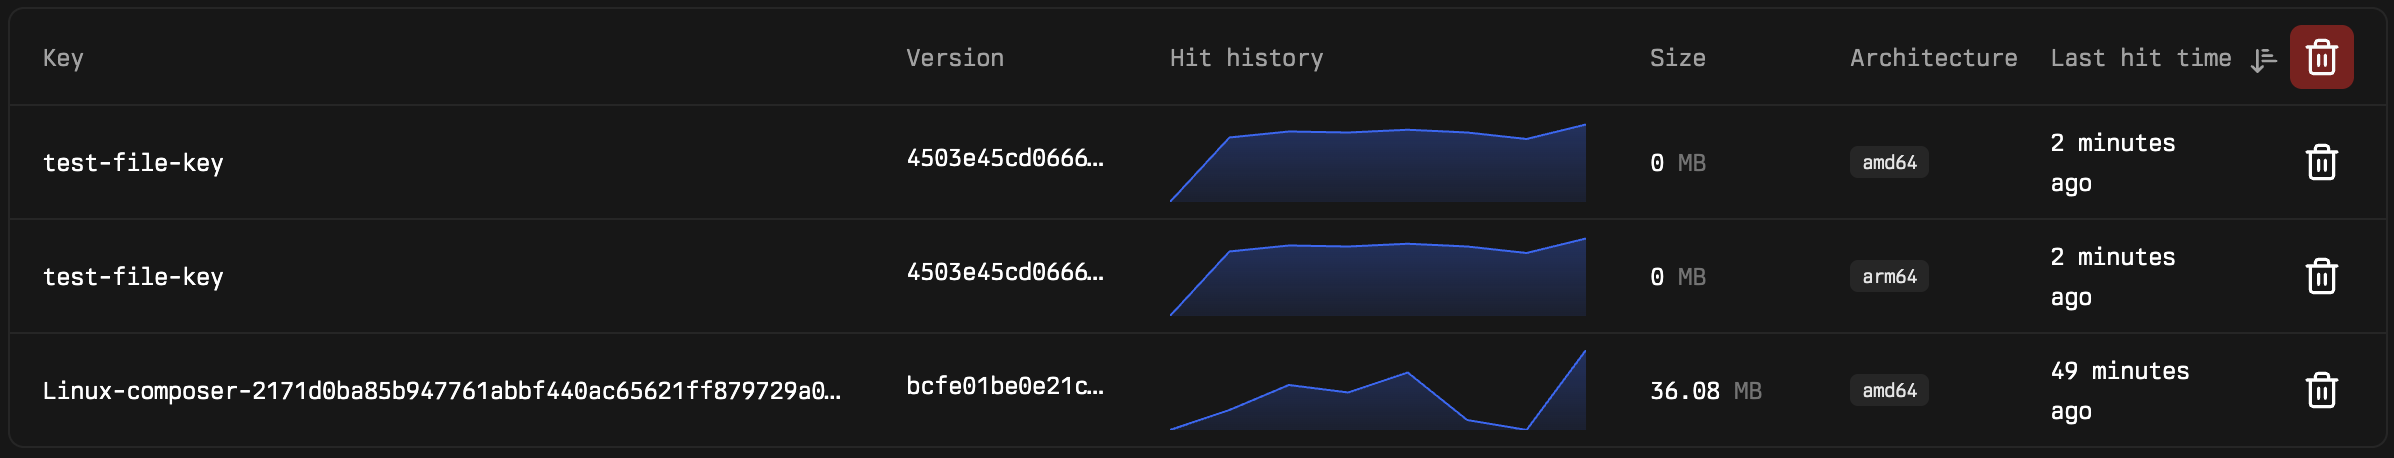
The dashboard also provides insights into every cache entry across your repositories.
### Caches
The dashboard also provides insights into every cache entry across your repositories.
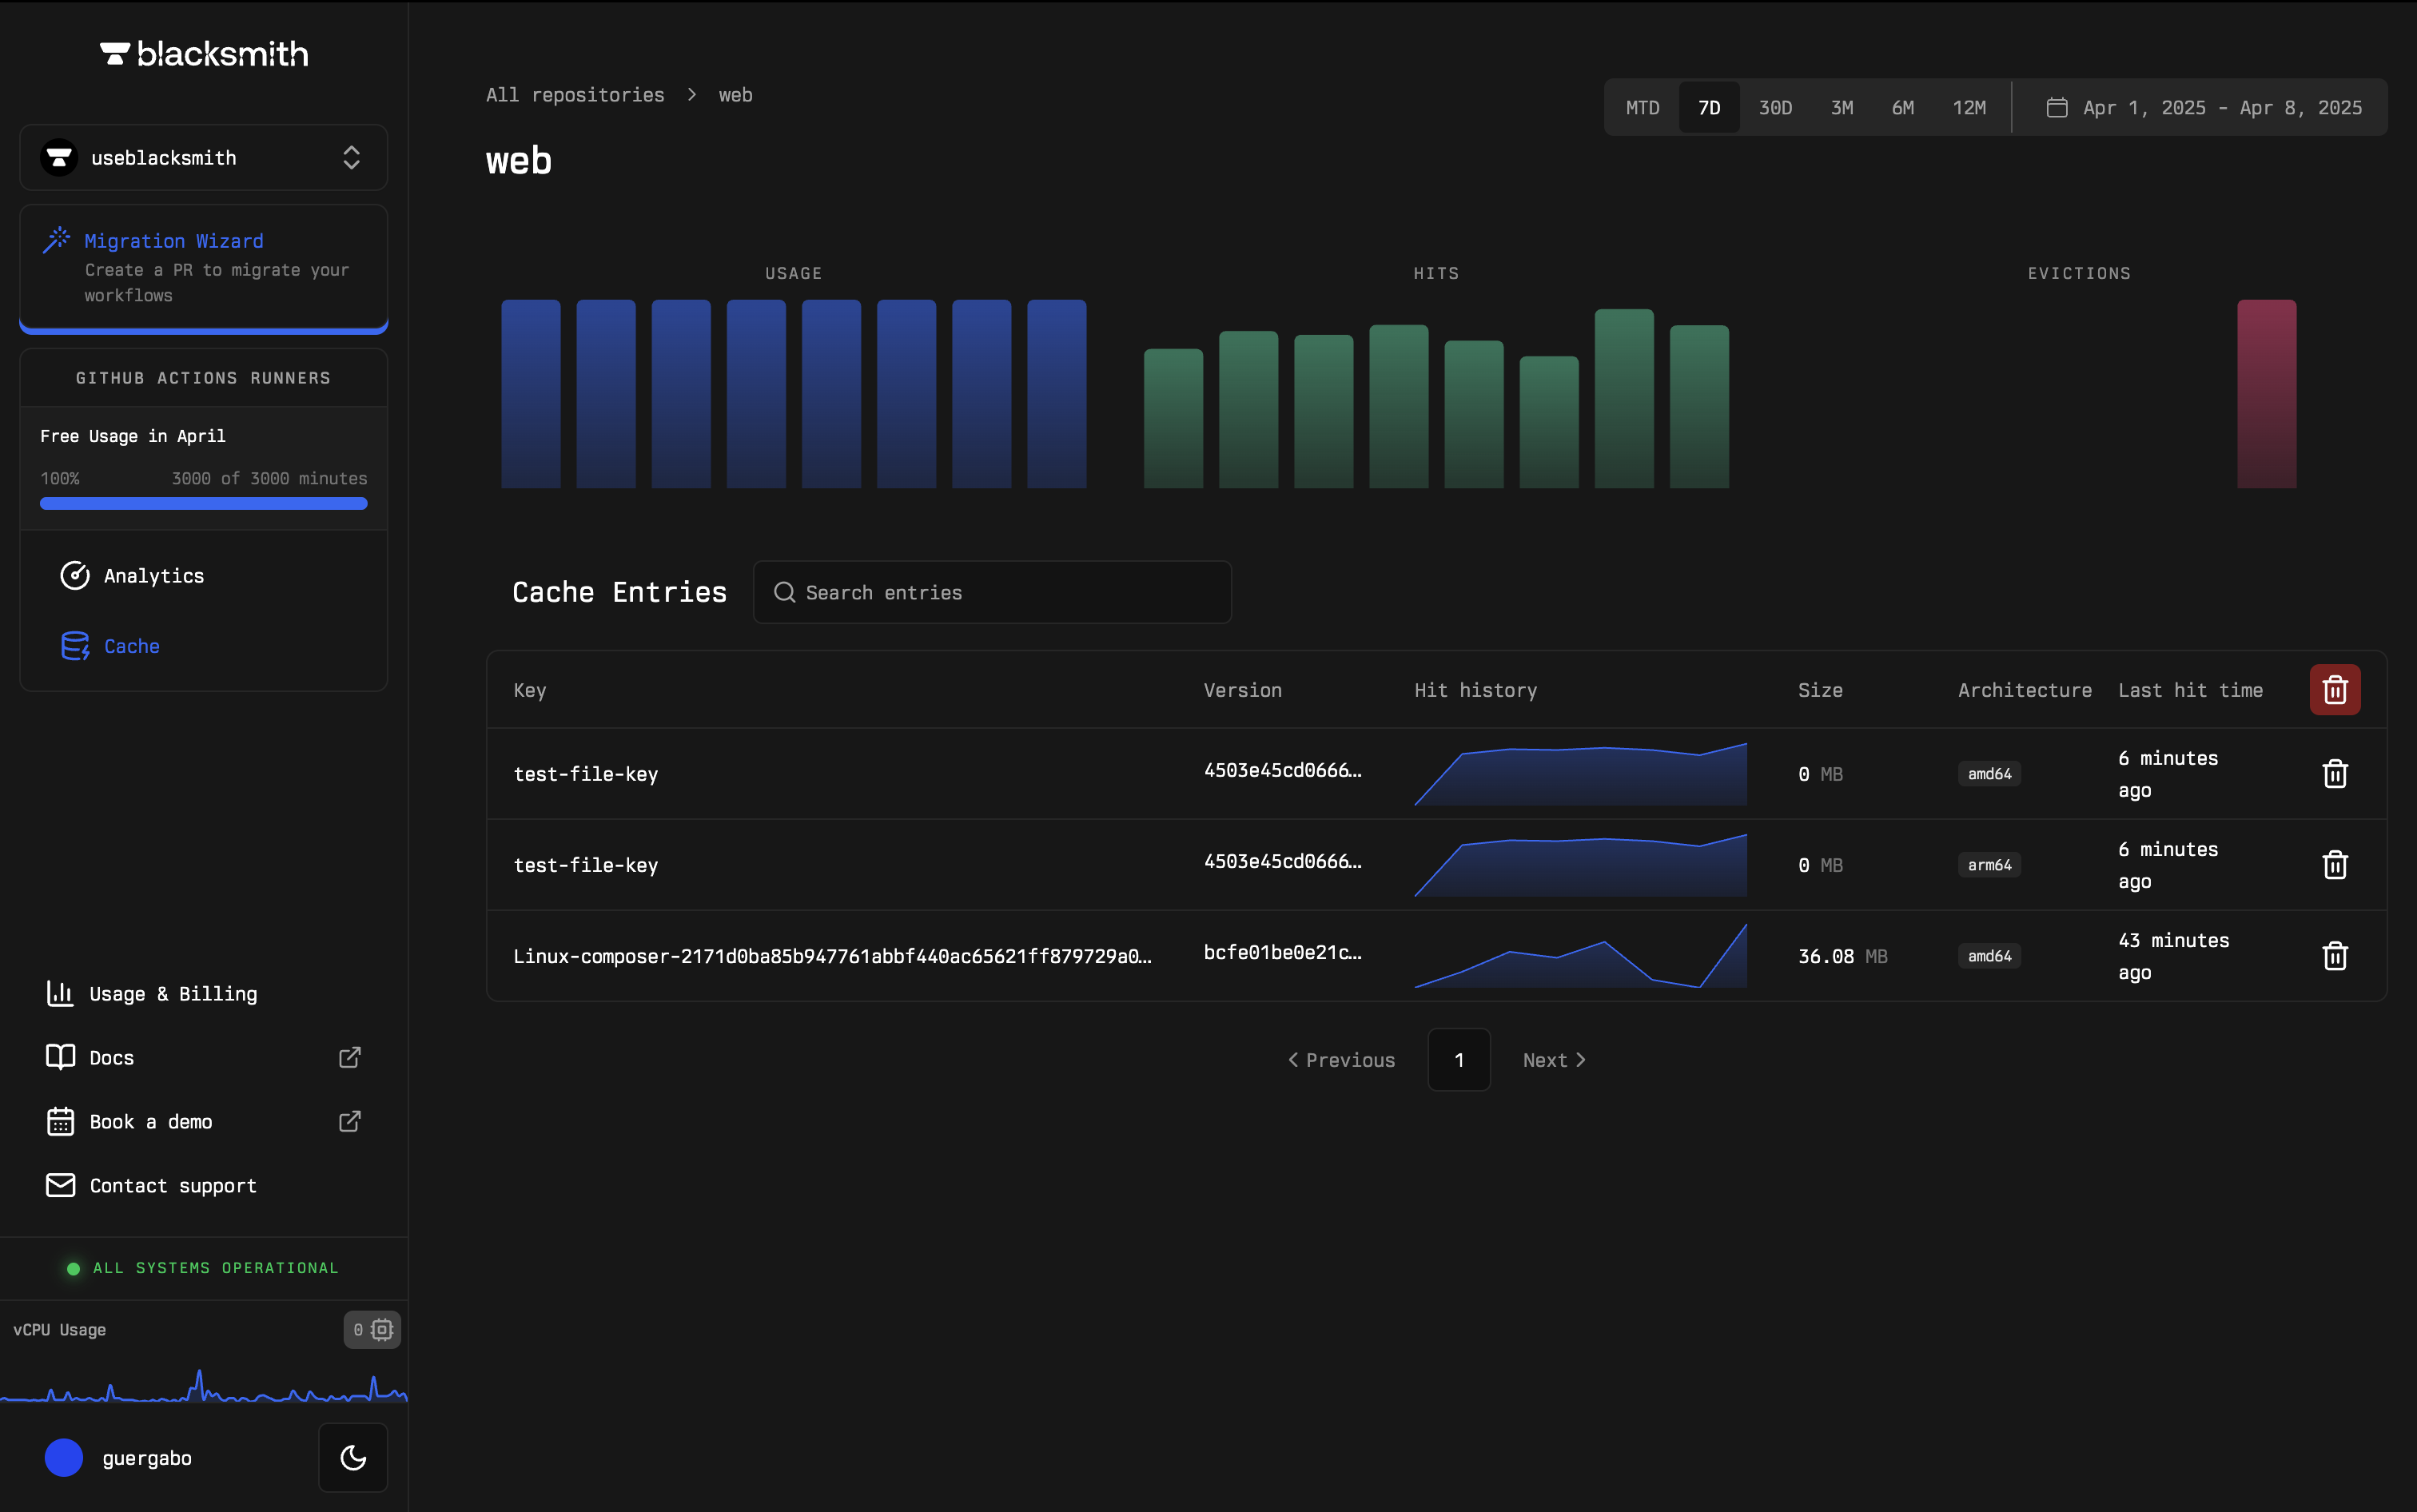 You can filter and analyze cache entries by repository, cache key, last hit time, and more, to answer questions like:
* "What is my total cache usage?"
* "What cache entries are currently available?"
* "How many recent cache hits have I had?"
Blacksmith makes it simple to track when a cache key was last hit. You can filter by repository to check the last hit time of cache entries, ensuring the cache key is functioning as expected.
You can filter and analyze cache entries by repository, cache key, last hit time, and more, to answer questions like:
* "What is my total cache usage?"
* "What cache entries are currently available?"
* "How many recent cache hits have I had?"
Blacksmith makes it simple to track when a cache key was last hit. You can filter by repository to check the last hit time of cache entries, ensuring the cache key is functioning as expected.
 ### Costs
The dashboard also provides visibility into all Blacksmith usage and billing.
### Costs
The dashboard also provides visibility into all Blacksmith usage and billing.
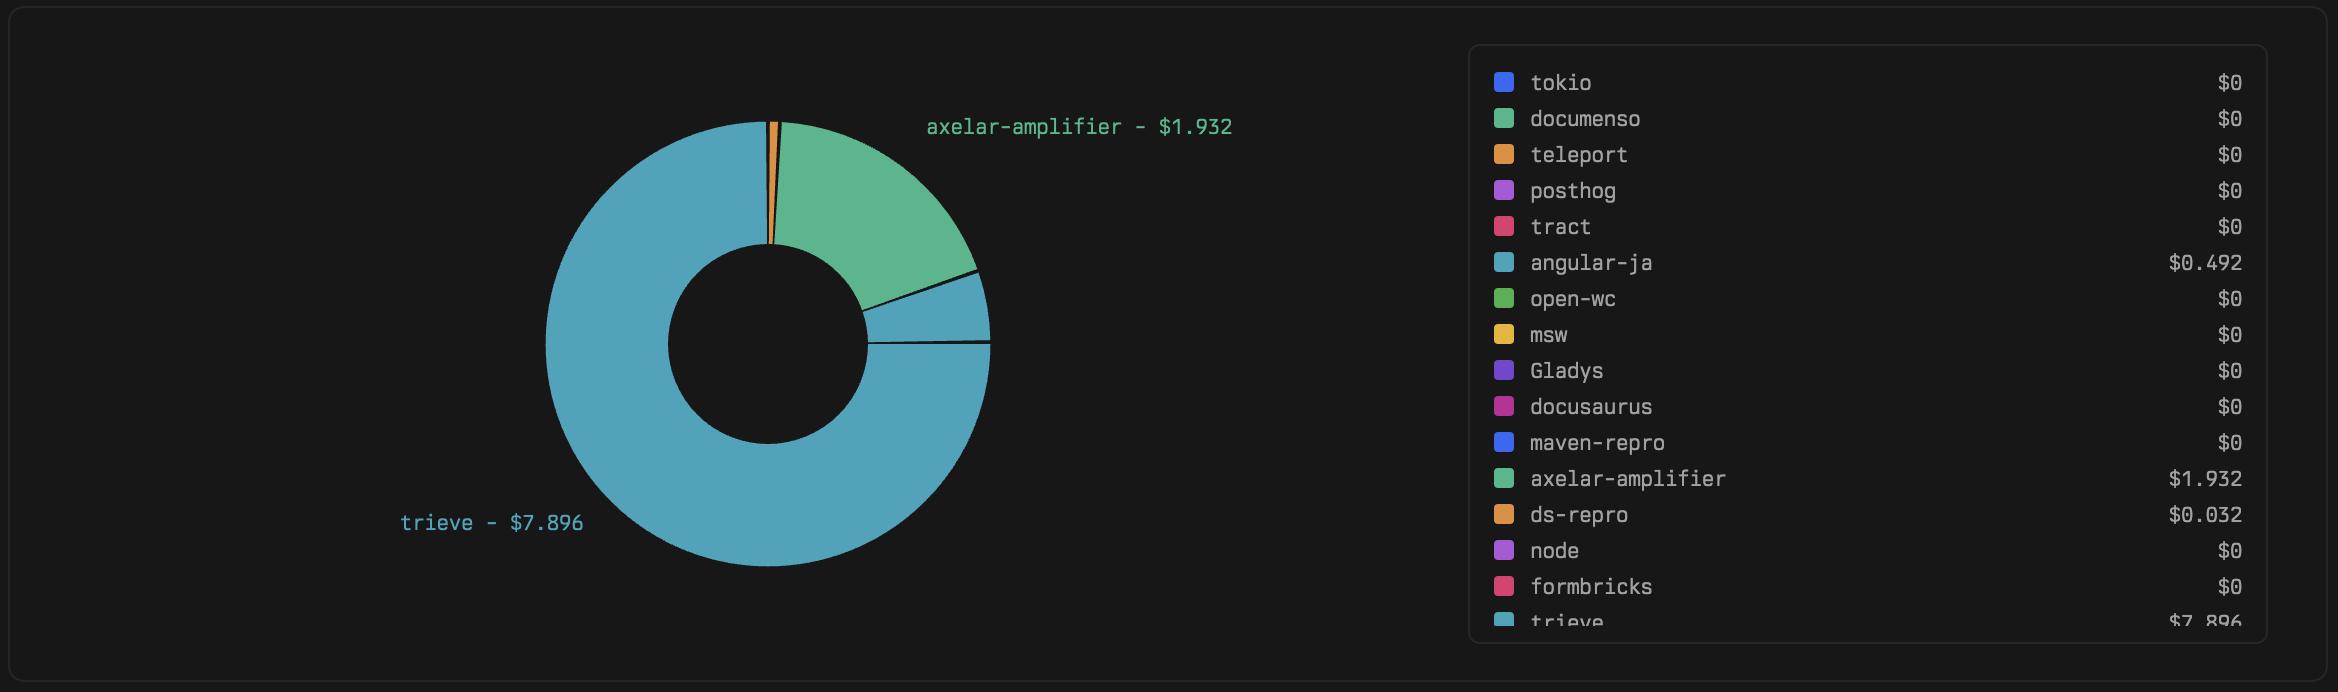
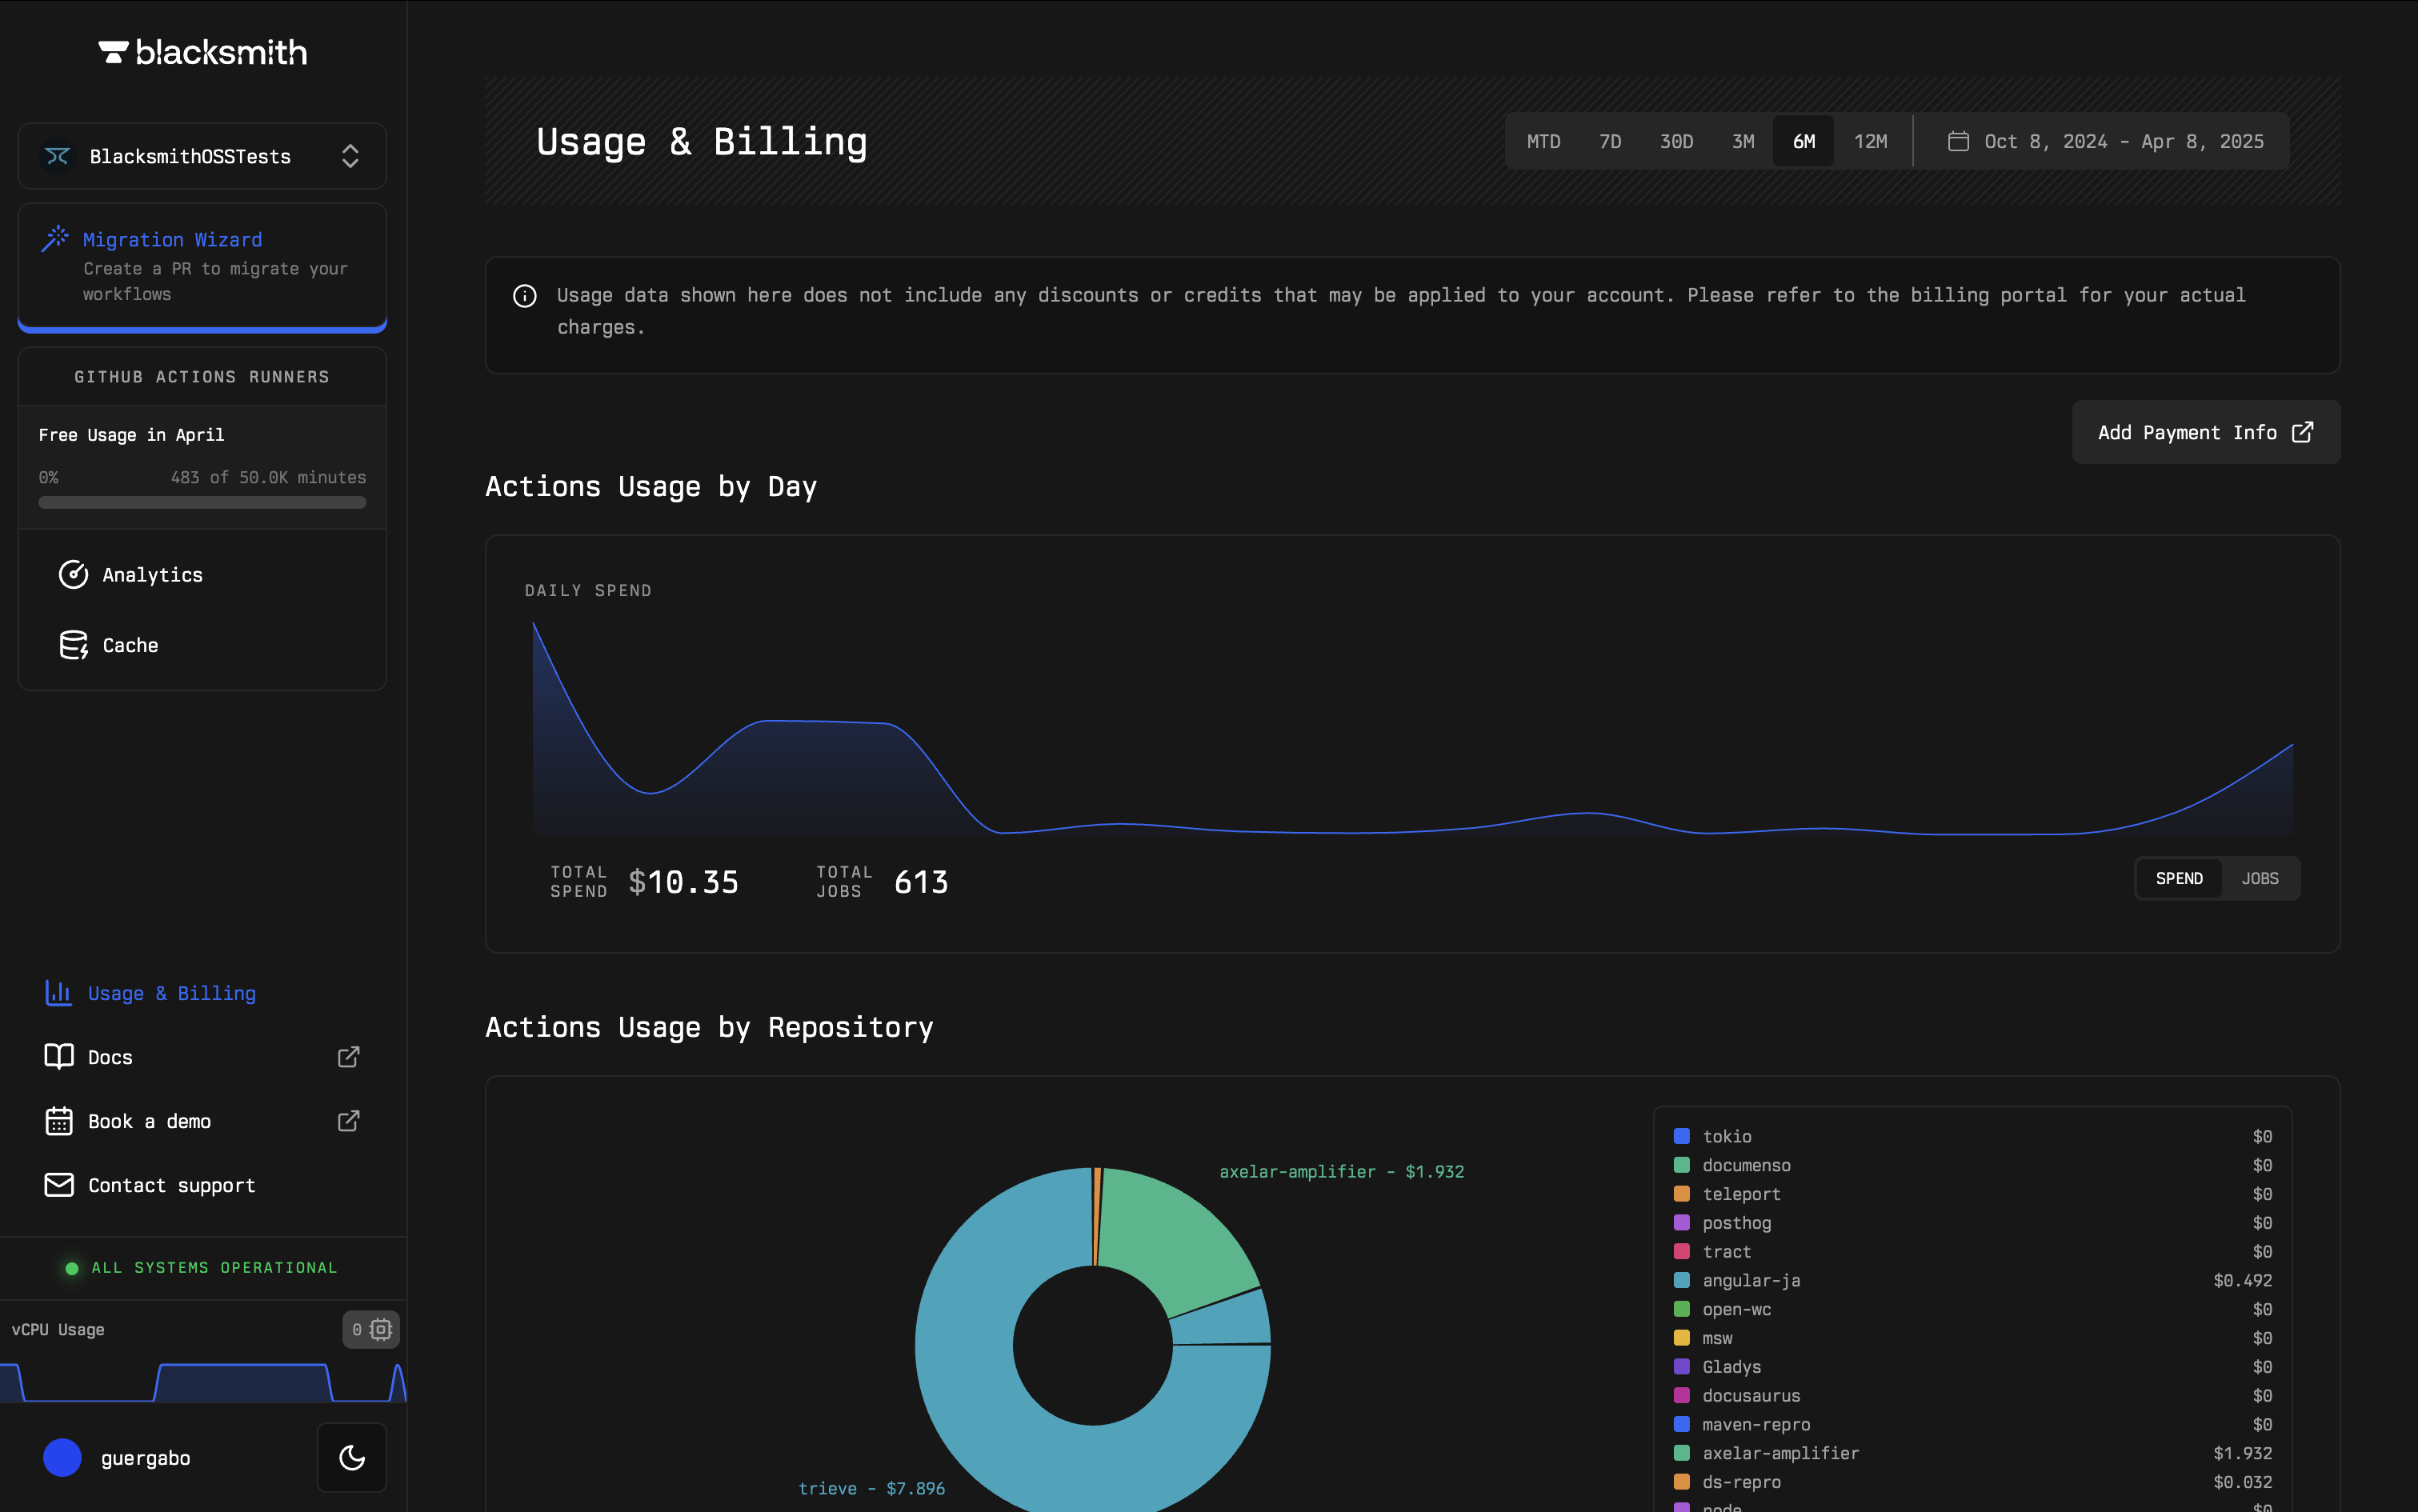 You can break down costs by repository to better understand CI expenses and ask questions such as:
* "How much more did I spend this month?"
* "Which repositories are consuming the most resources?"
* "How much am I spending on storage for caches?"
With Blacksmith you can track spending across repositories to identify how your teams and services are consuming compute and storage resources.
You can break down costs by repository to better understand CI expenses and ask questions such as:
* "How much more did I spend this month?"
* "Which repositories are consuming the most resources?"
* "How much am I spending on storage for caches?"
With Blacksmith you can track spending across repositories to identify how your teams and services are consuming compute and storage resources.
 We are continuously working on additional visualizations. If there is something specific you'd like to see, feel free to reach out to us at [hello@blacksmith.sh](mailto:hello@blacksmith.sh).
## Pricing
There is no additional cost for using this feature. For all other pricing, please visit our [pricing page](https://www.blacksmith.sh/pricing).
We are continuously working on additional visualizations. If there is something specific you'd like to see, feel free to reach out to us at [hello@blacksmith.sh](mailto:hello@blacksmith.sh).
## Pricing
There is no additional cost for using this feature. For all other pricing, please visit our [pricing page](https://www.blacksmith.sh/pricing).