Overview
Blacksmith’s CI Analytics dashboard provides a single view of your CI pipeline’s performance, failure rate, and costs. All users within your organization who have access to GitHub can log in at app.blacksmith.sh to explore the dashboard.Basics
Jobs
The dashboard displays every job run across all your repositories.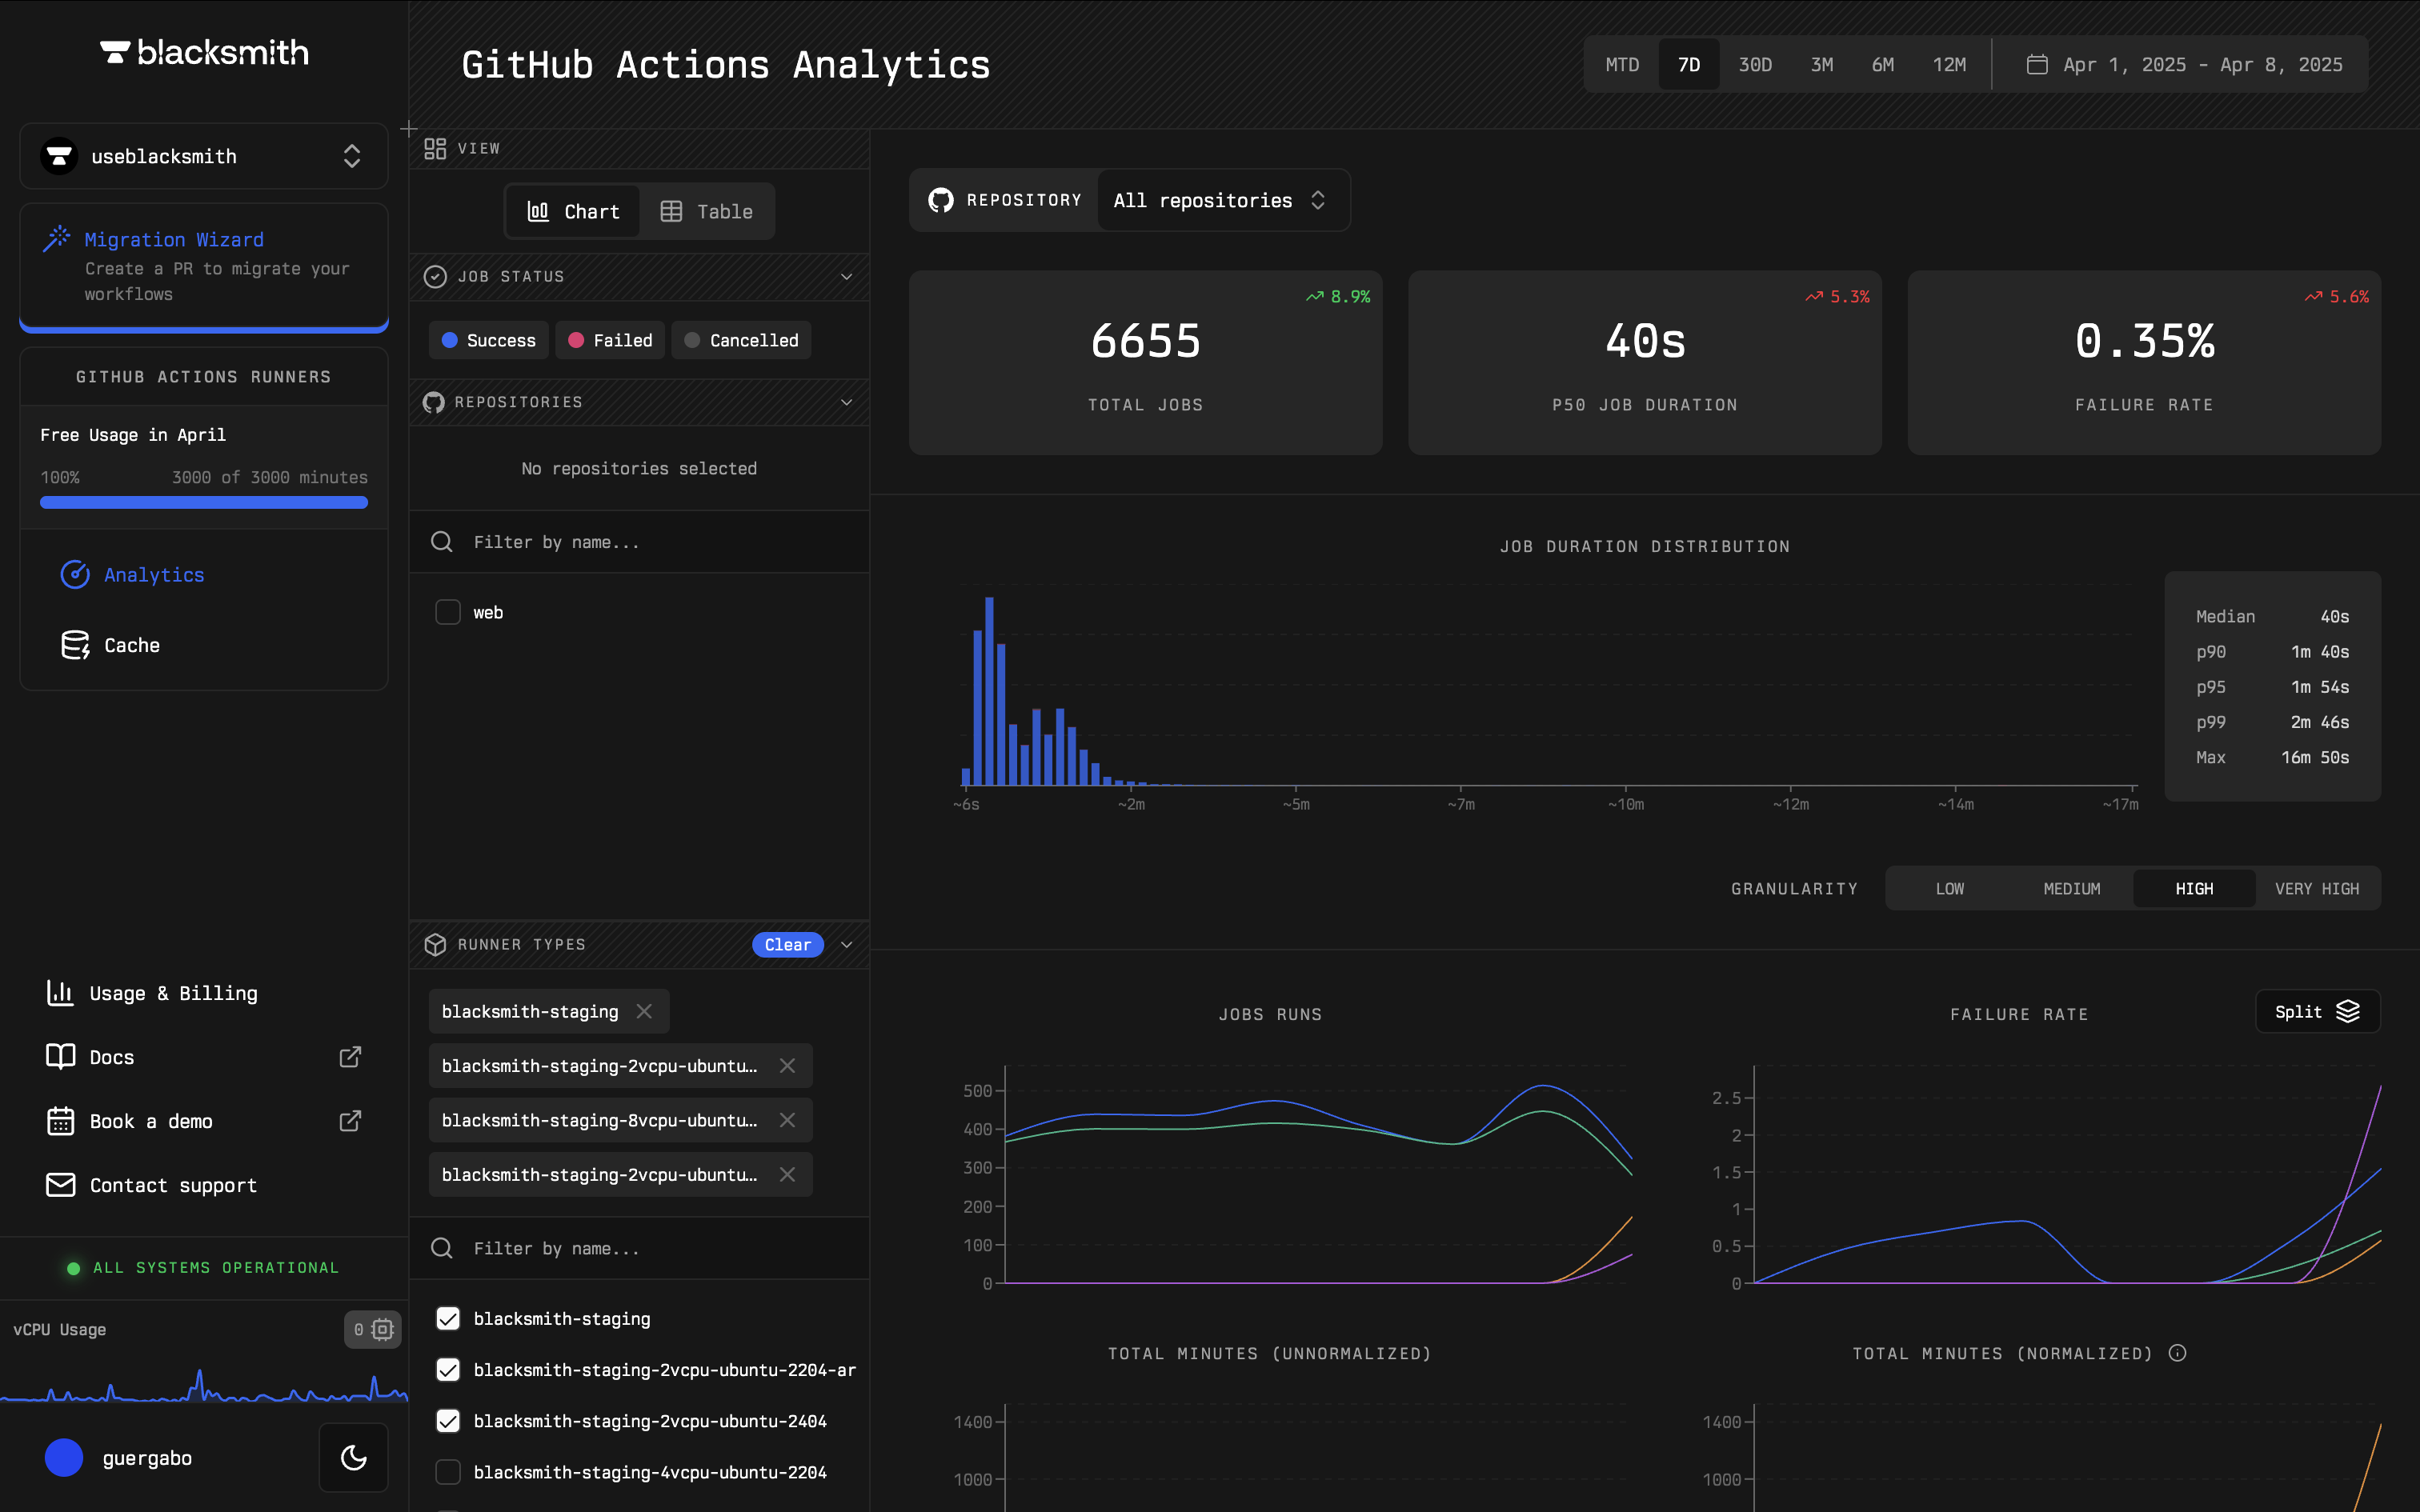
- “What is the failure rate of my jobs?”
- “How long does this job typically take to complete?”
- “What is affecting the performance of my slowest job?”
Zoom In: Finding out if a Job is Failing More Than Usual
For instance, Blacksmith’s dashboard helps identify if a job is failing more often than usual. By filtering jobs by repository, you can assess failure rates and compare them to previous months.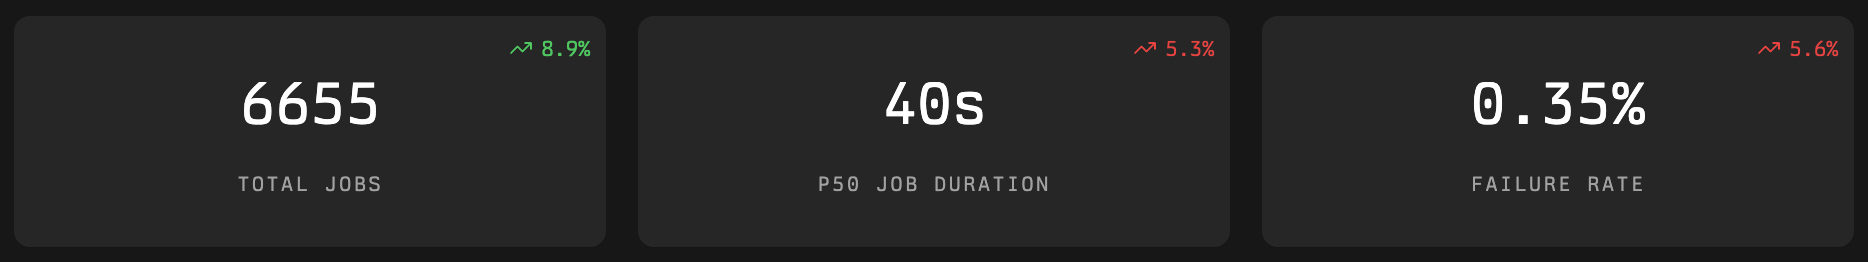
Zoom In: Finding out What is Affecting the Performance of Your Slowest Job
Blacksmith’s dashboard helps identify what is affecting the performance of your slowest job. By hovering over the “p99” in the job duration distribution chart, you can see a breakdown of your slowest job’s steps and the time taken for each step.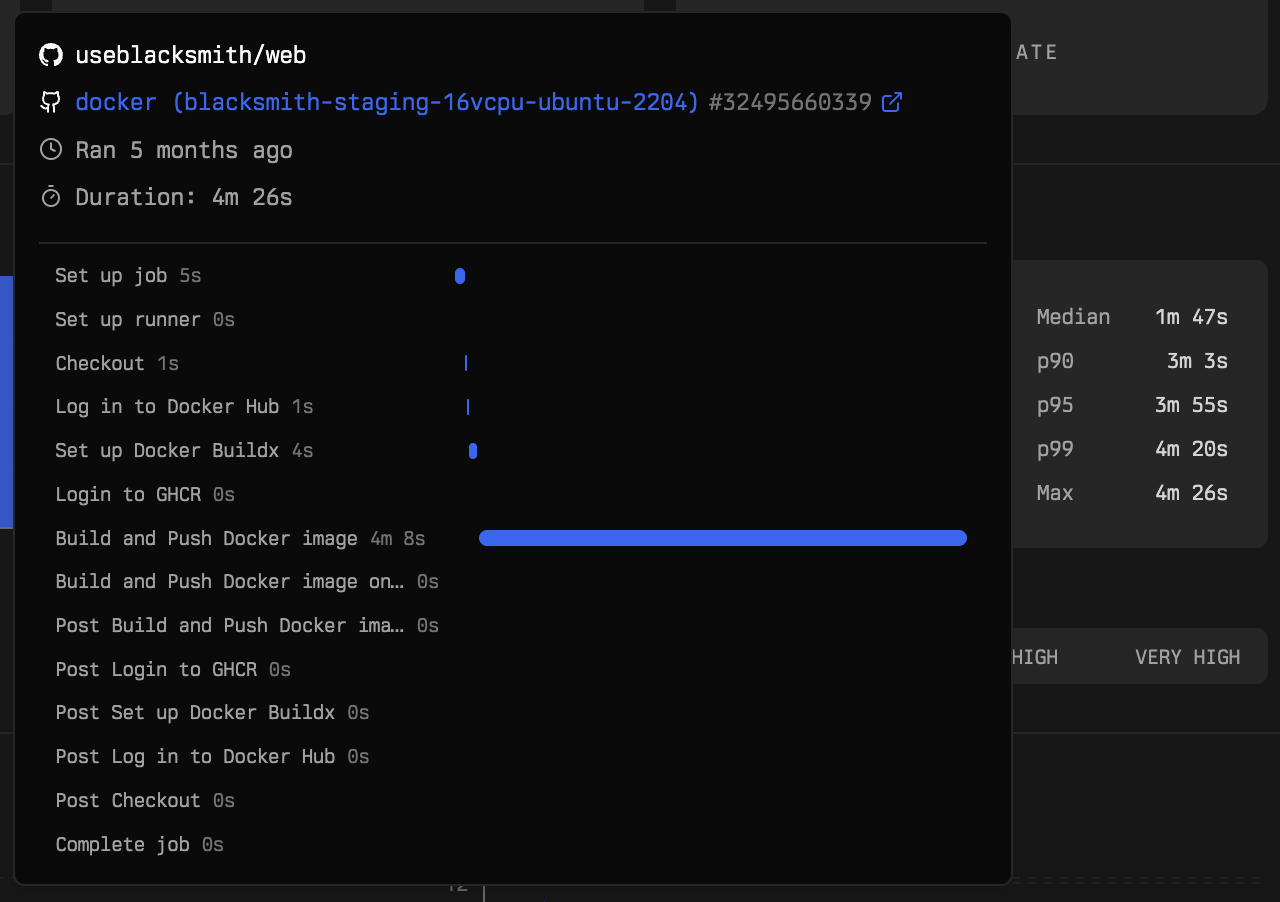
Caches
The dashboard also provides insights into every cache entry across your repositories.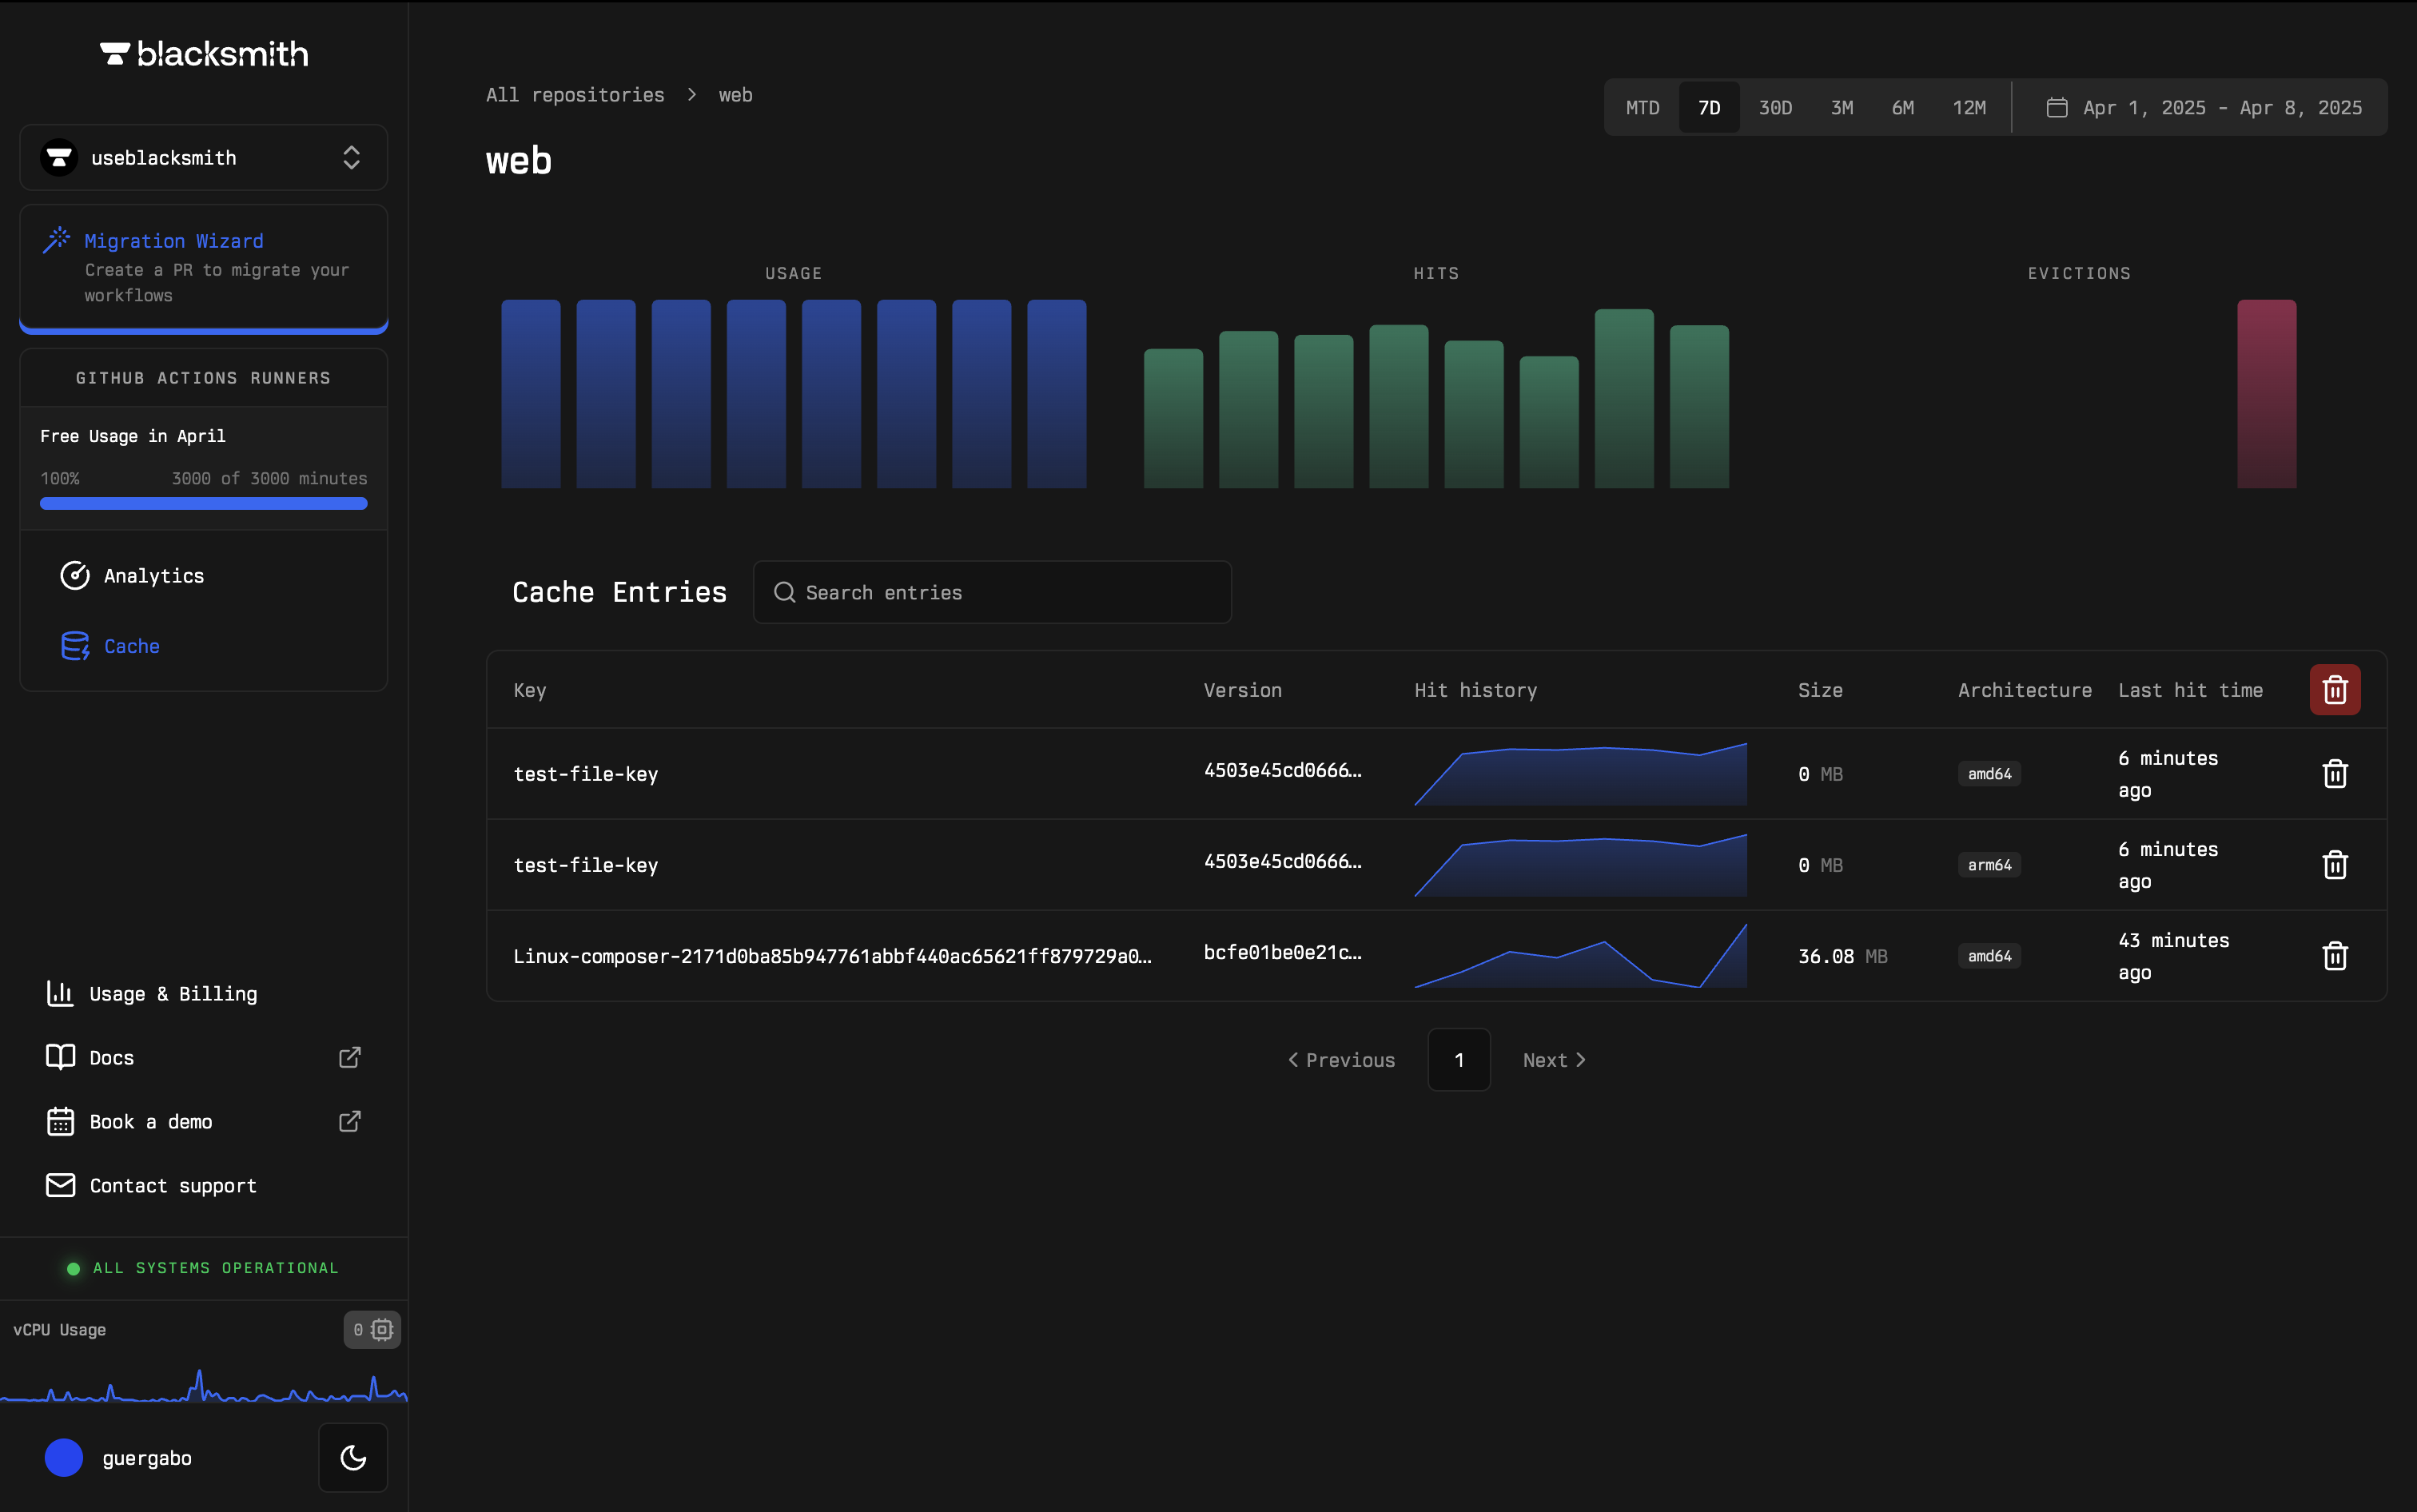
- “What is my total cache usage?”
- “What cache entries are currently available?”
- “How many recent cache hits have I had?”
Zoom In: Finding the Last Cache Hit for a Specific Key
Blacksmith makes it simple to track when a cache key was last hit. You can filter by repository to check the last hit time of cache entries, ensuring the cache key is functioning as expected.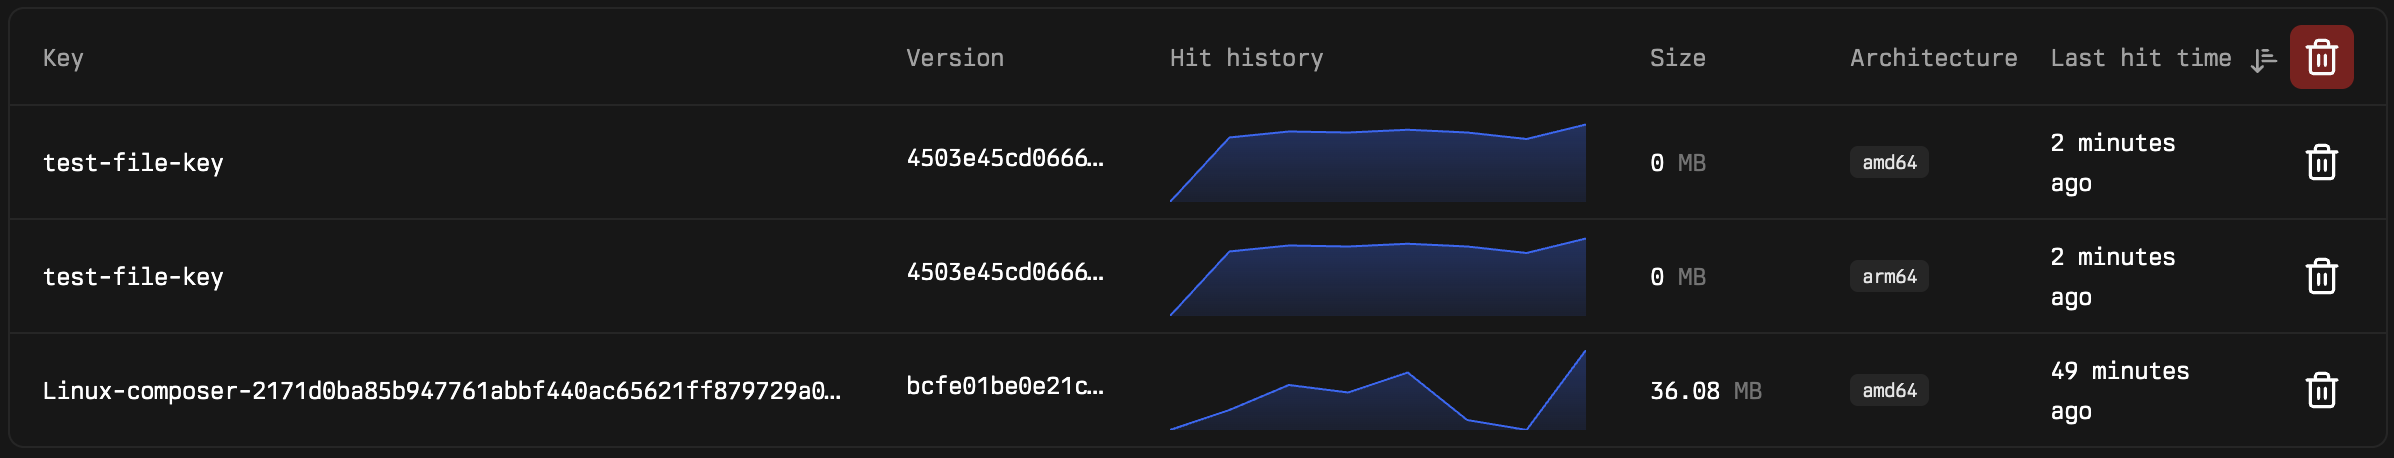
Costs
The dashboard also provides visibility into all Blacksmith usage and billing.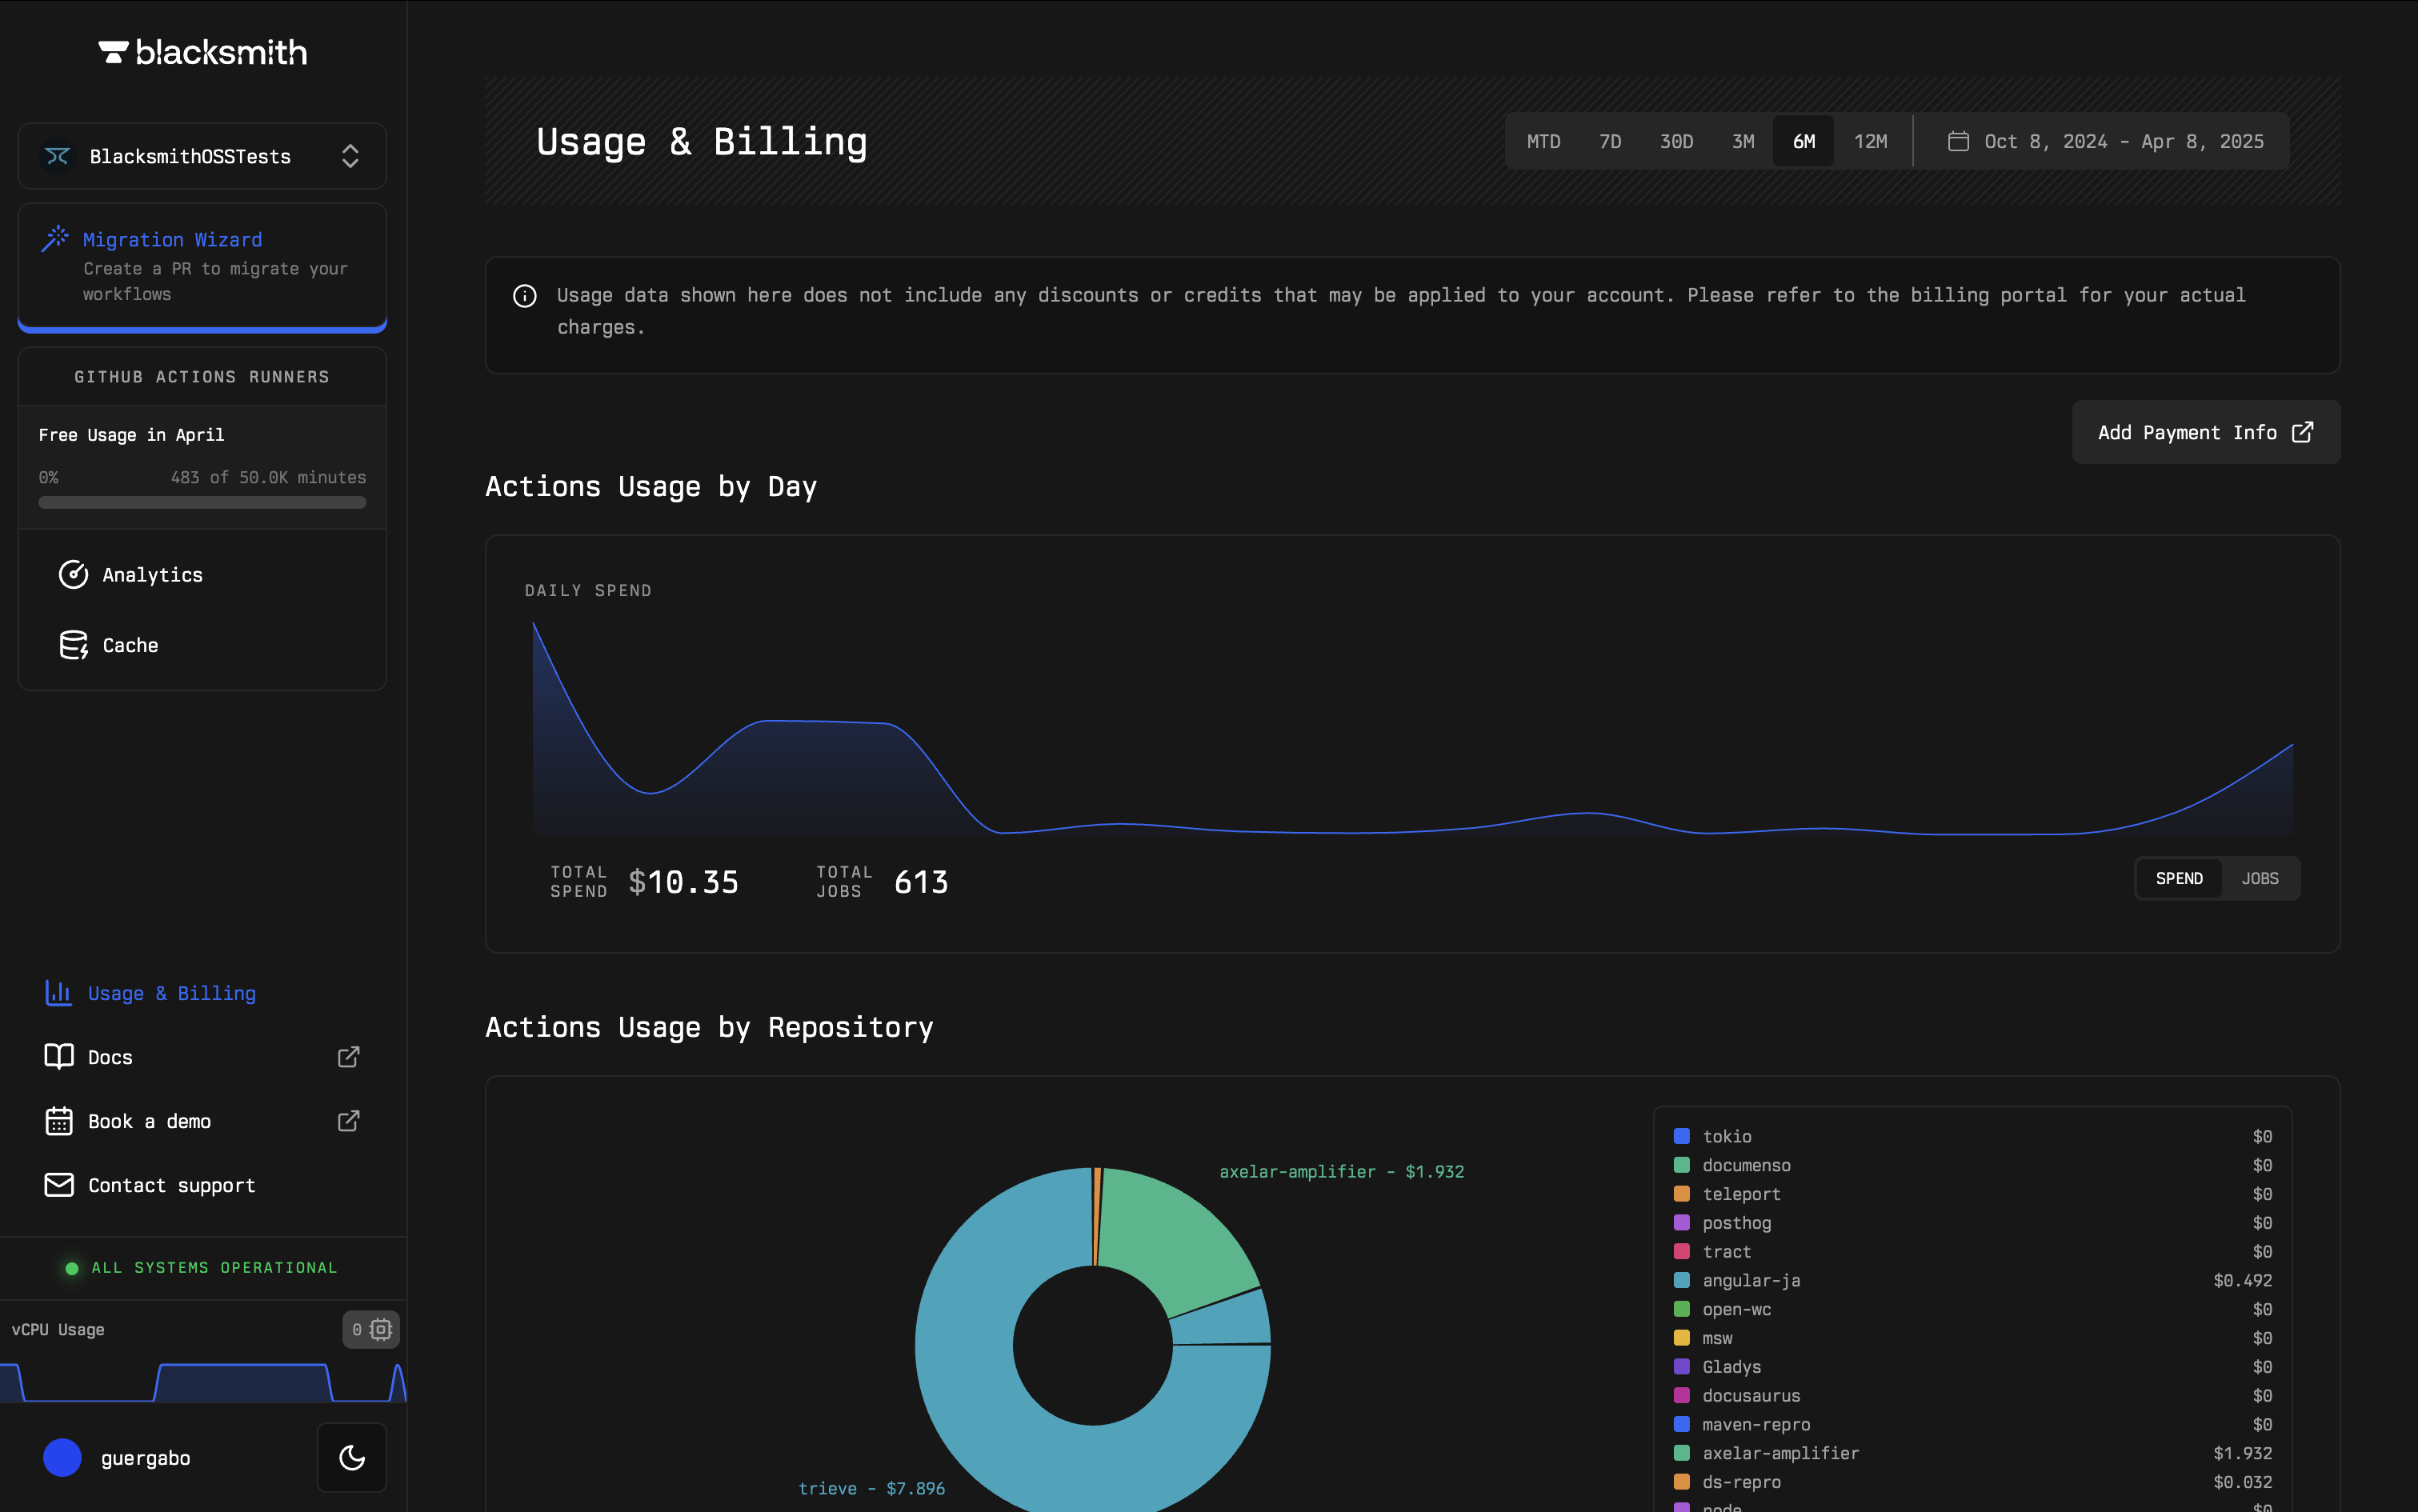
- “How much more did I spend this month?”
- “Which repositories are consuming the most resources?”
- “How much am I spending on storage for caches?”
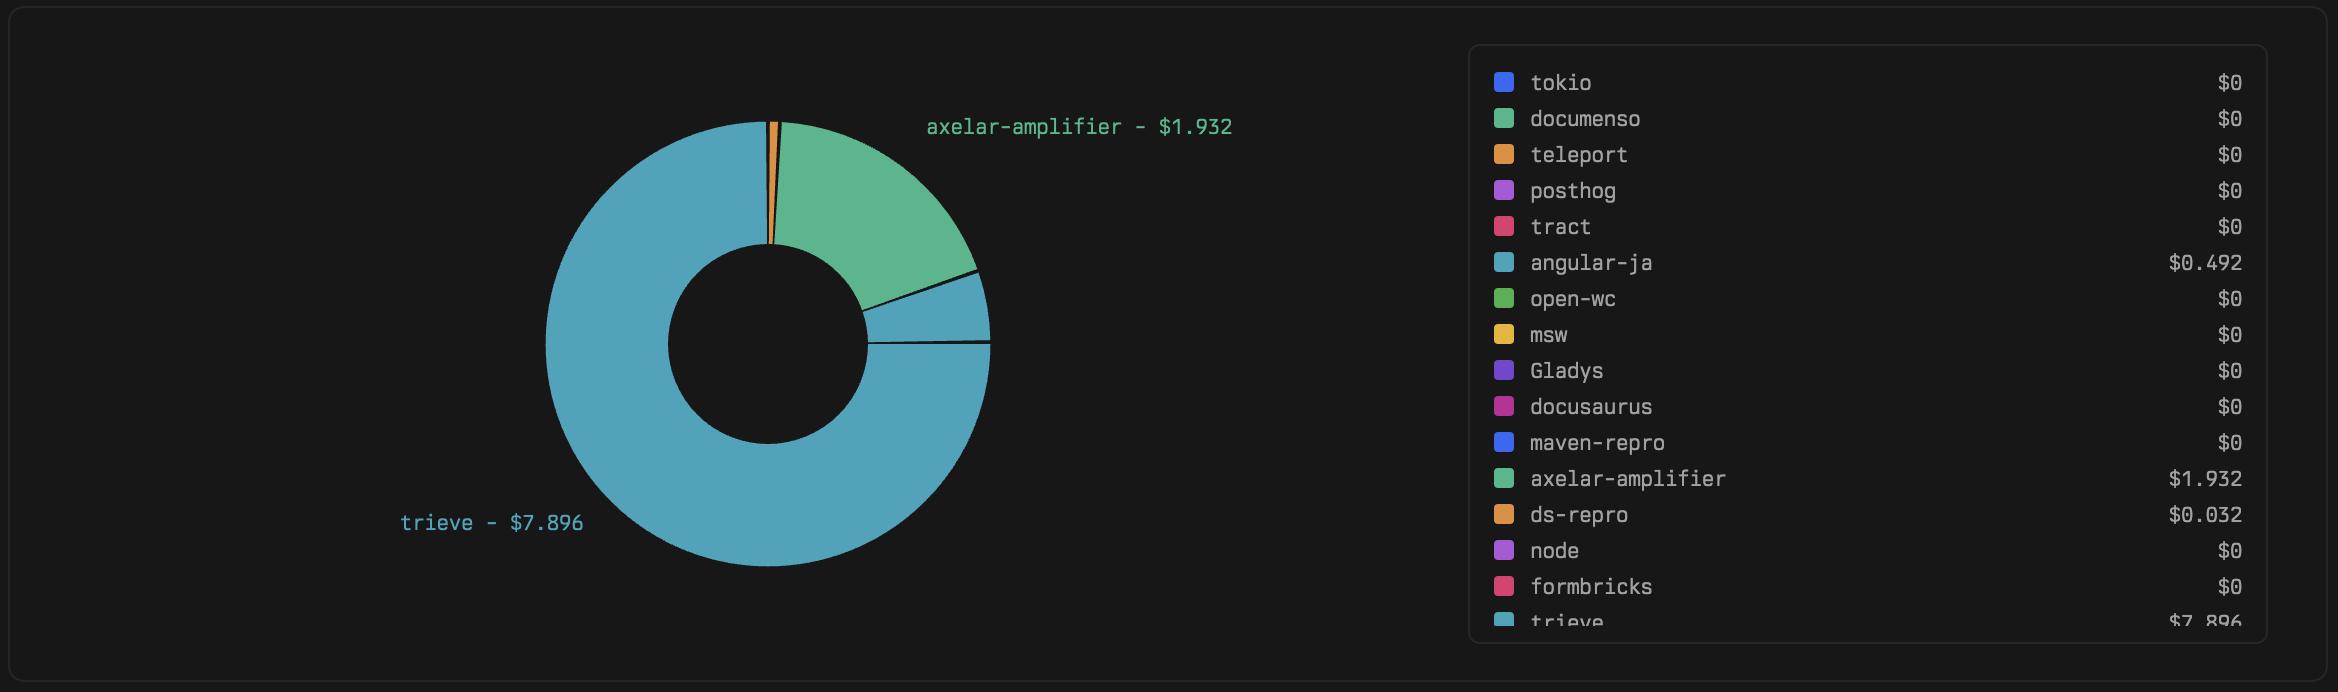
Zoom In: Finding out which repositories are consuming the most resources
With Blacksmith you can track spending across repositories to identify how your teams and services are consuming compute and storage resources.