Overview
Blacksmith automatically collects machine metrics for all jobs that are run on Blacksmith runners. No configuration required. Blacksmith’s Metrics provides a way to check whether your jobs are running into resource constraints or if your job runners are overprovisioned. All users within your organization who have access to GitHub can log in at app.blacksmith.sh to view metrics on their jobs.Basics
Job Metrics
The Metrics tab in the Job Details view in the dashboard displays machine metrics for a job run.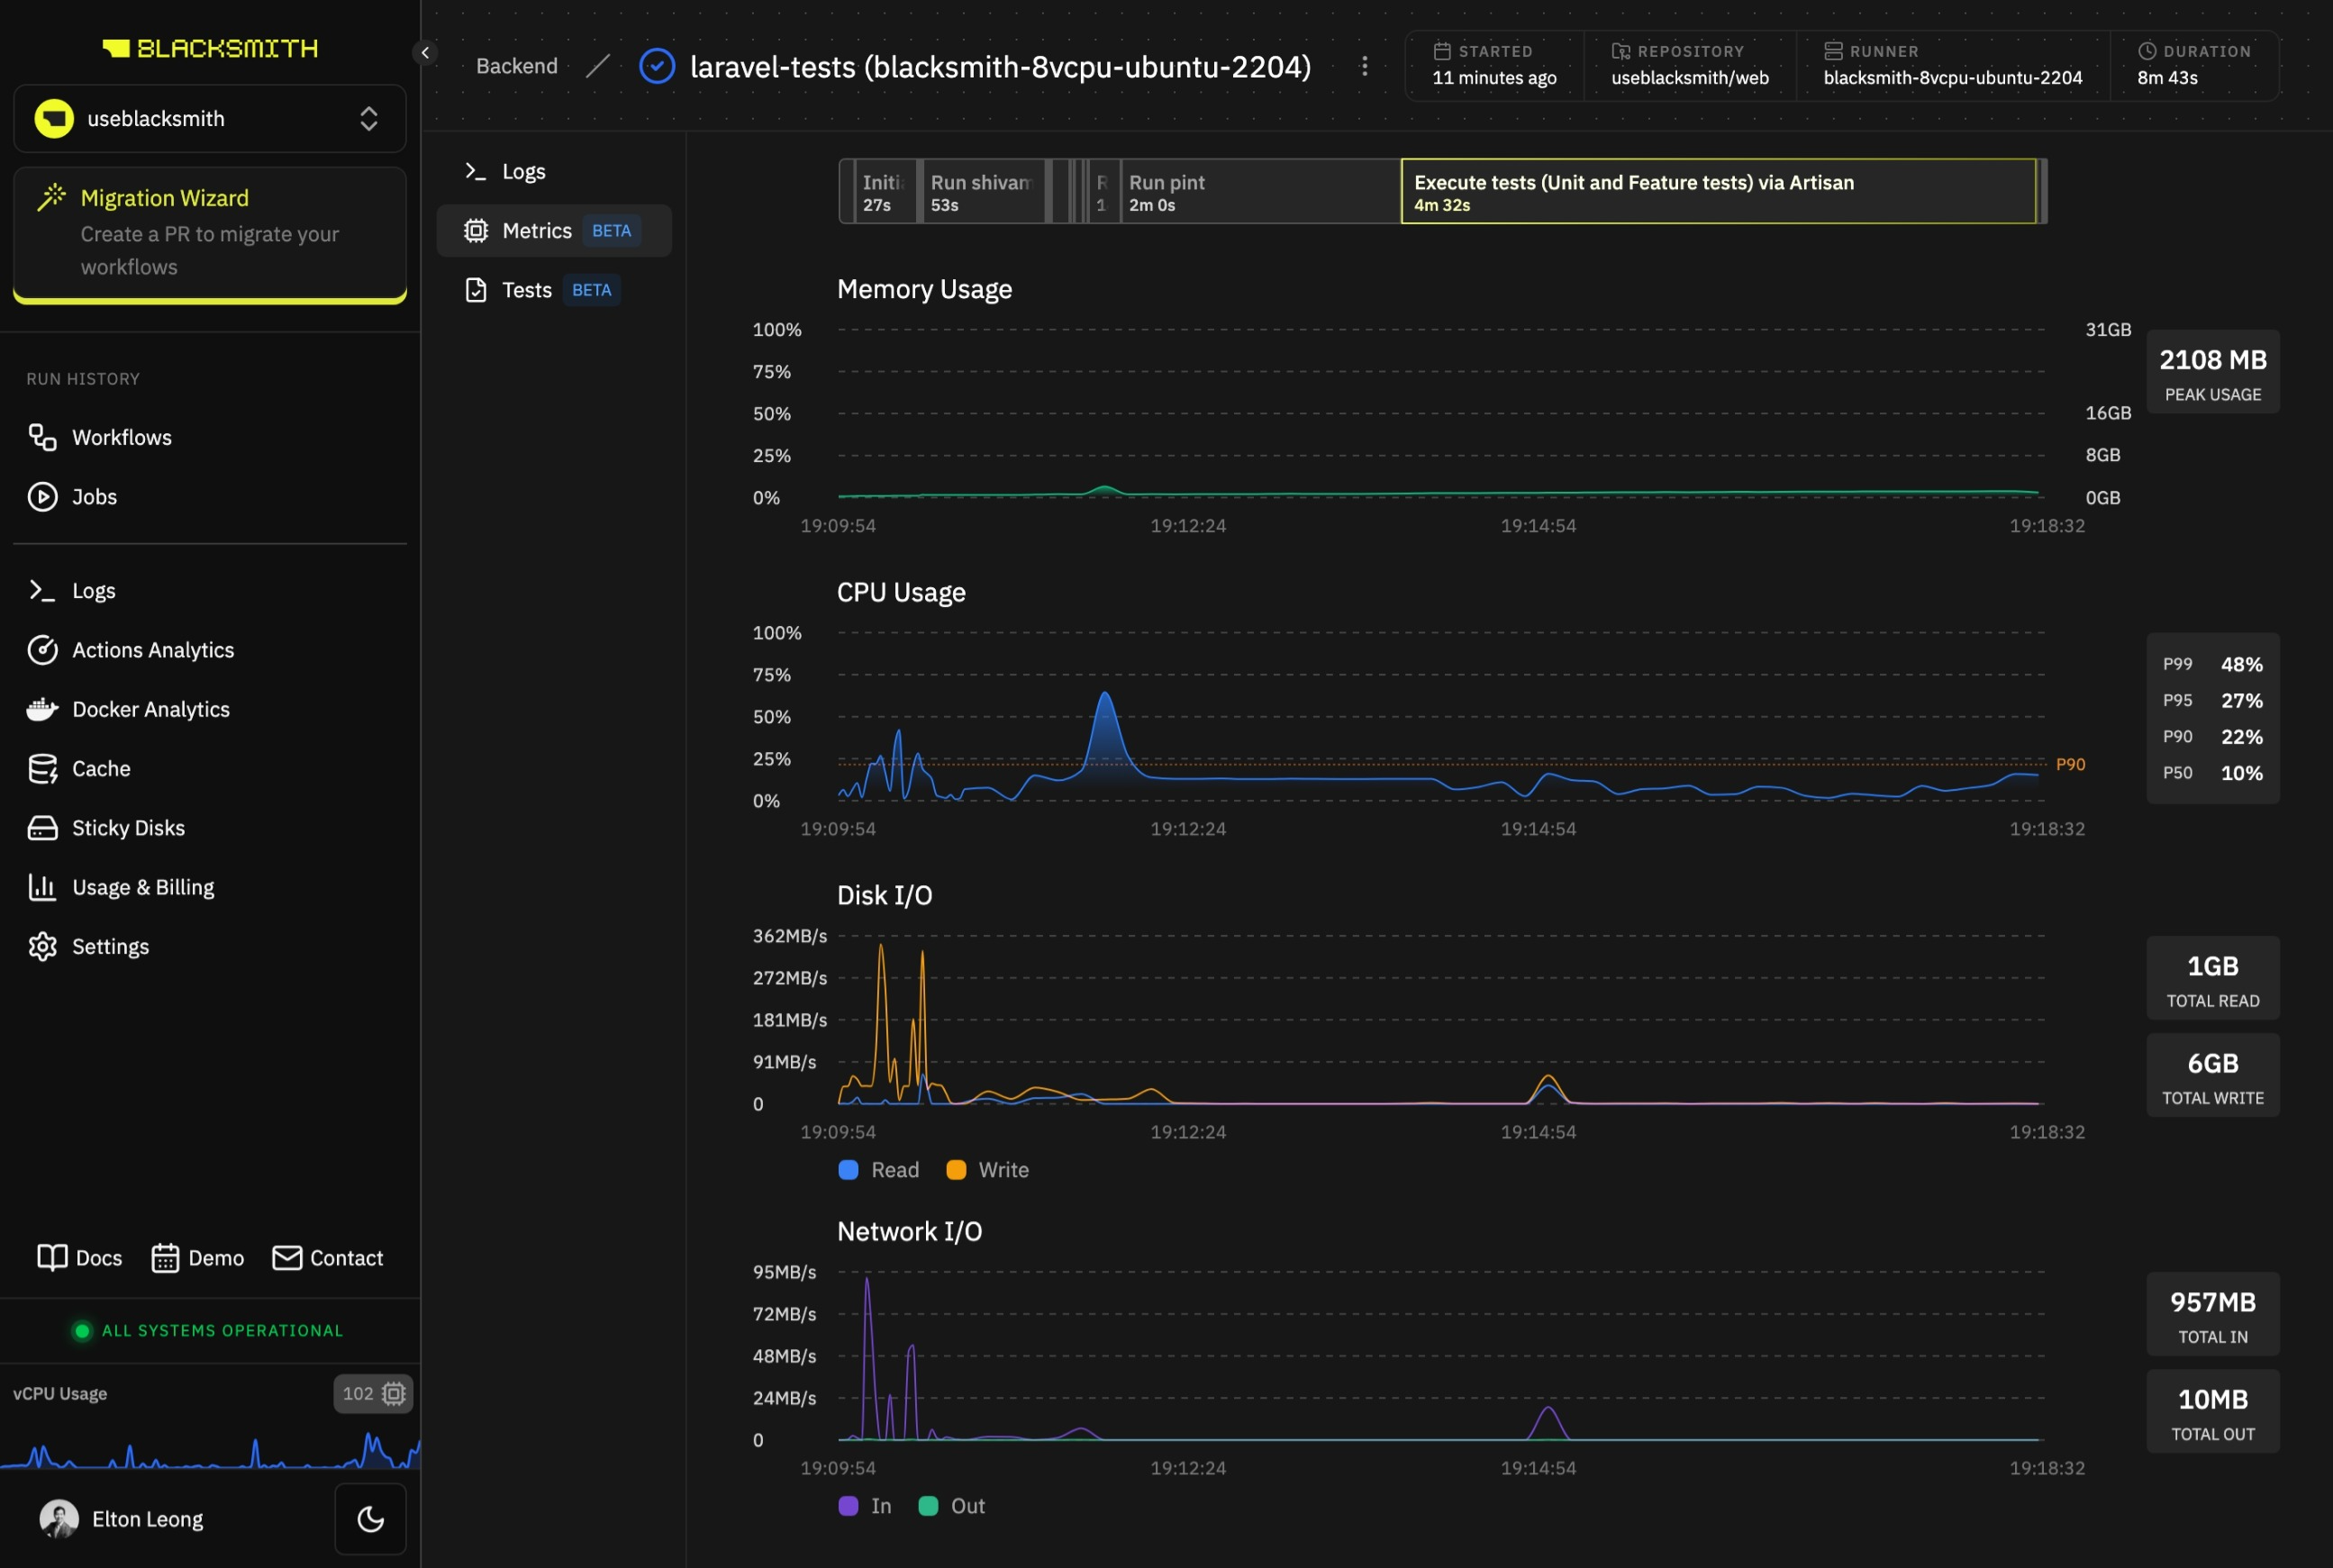
Job Step Timeline
You can jump to the logs for a specific step of a job run. Just click on a step in the timeline displayed above the charts to go to the Logs tab with the relevant log section automatically expanded.Common Use Cases
Debug Slow Jobs
- Check for high CPU usage or memory usage for a job. If the runner is undersized for the job’s workload, the job may take longer than expected.
- Check for lower network I/O than expected for a job. If there is network degradation between Blacksmith’s runners and the servers your job communicates with, dependency downloads and Docker image pushes/pulls may be slower.